It was the best of times, it was the worst of times, it was the age of wisdom, it was the age of foolishness, it was the epoch of belief, it was the epoch of incredulity, it was the season of Light, it was the season of Darkness, it was the spring of hope, it was the winter of despair, we had everything before us, we had nothing before us… – A Tale of Two Cities
It certainly feels that the financial world today is revolving around what the central bankers are going to do next, meeting-by-meeting. With all eyes on the details of inflation and the labour market data, few are paying attention to what is happening on the other side of the globe. As the saying goes, when America sneezes, the whole world catches a cold. No wonder that investors and policymakers around the world pay most attention to the macroeconomic development happening in the U.S. Meanwhile, across the Pacific Ocean another economic giant with no less important role in the global economy is undergoing through massive changes that has long-term structural impact, not only for its own economy, but also for the rest of the world.
Reading through my morning newspaper over the past year, there is a stark contrast between the headline news coming out of the U.S. and China. Whereas inflation has been on top of mind in the U.S., deflation is what worries businesses and government across the Pacific Ocean. And as the tight post-pandemic labour market in the U.S. allows workers to negotiate higher wages and look for better opportunities, workers in China are taking pay cuts across both public and private sectors. The trajectories of economic recovery in the U.S. and China could not be more different. Whereas consumer and government fiscal spending roared following the easing of lockdown restriction in the U.S., the extended lockdown and inadequate fiscal support in the Middle Kingdom have sapped the appetite for consumers and private sectors to spend. In fact, Chinese household spending growth has been below that of the U.S. following the pandemic (Chart 1). Is the pandemic a shock to China equivalent to what Japan experienced in the 1990s, just before it entered very low growth and deflationary regime?

It is becoming evident that China will have a difficult time to maintain its 5% growth target going forward amid the domestic property sector crisis and increasingly unfavorable geopolitical environment. As the tensions between the U.S. and China continues to intensify, Beijing’s focus to prioritize domestic technological innovation and expanding its exports market are facing a backlash from the U.S. and European governments. The U.S. is expanding its restrictions on advanced chips exports to China, hampering the government’s efforts to move higher in the value chain, while European Commission is opening an anti-subsidy investigation into Chinese electric vehicles (Chart 2). Western governments have been re-evaluating their supply-chain’s dependency on China and incentivizing companies to diversify their production base. On ideological basis, the U.S. and China are also on a polar opposite in many issues, including on Russian invasion of Ukraine, the future of Taiwan, and basic values such as human rights and the rule of law. The bottom line is that the benign geopolitical environment that had supported rapid Chinese GDP growth since it joined WTO in 2001 is now reversing.
On top of this, private businesses in China are not in the mood for reinvesting their profit and expand their operation amid lackluster consumer demand and repeated government crackdown on sectors that are deemed to create instability and increase inequality, including in the tech sector (Chart 3). Contrast this with the U.S. government efforts to rejuvenate its physical infrastructure and its subsidies for the advanced manufacturing industry (i.e., semiconductor).
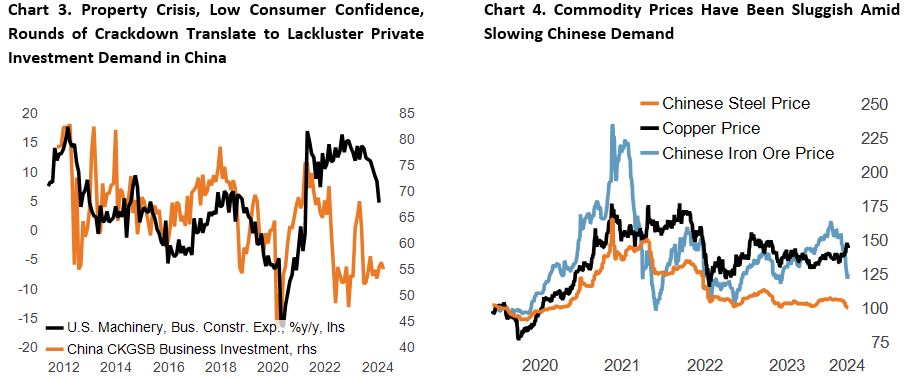
Given the limited foreign ownership of Chinese assets and capital flow restriction, the global financial linkage to the rest of the world should be relatively limited. The largest impacts of slowing Chinese economy and its property sector crisis are most visible in the trade channel and the commodity market, in which China is a major consumer. Over the past two years, Chinese goods export prices have been decelerating sharply, and the prices of select base metals have been sluggish despite the above-trend economic growth across developed countries (Chart 4).
Following decades of booming economy and significant increase in both public and private sector leverage, Beijing is certainly aware of the risk potentially arising from prolonged slump of the real estate sector, insolvent local governments, and the need to stimulate growth. However, the fiscal support provided so far has mainly focused on putting a floor on growth and containing the crisis, rather than outright net new stimulus. In contrast to the infrastructure building seen in previous fiscal stimulus (2008, 2015, 2018), today the central government instead told indebted provinces to scrap select infrastructure projects to save money, which should translate to lower growth in both the near and long term (Chart 5). Given that real estate and infrastructure investment is unlikely to be the primary driver for growth, meeting its growth target of 5% this year will require a strong recovery in consumer demand (Chart 6).

But Chinese consumers are also not in the mood to spend as their household wealth decline. This is related to the fact that real estate accounts for 41% of Chinese household wealth compared to a much lower 26% in the U.S. In many large Chinese cities, the prices of house and apartment are estimated to have fallen 20-30% from its peak. In a recent survey by PBoC, 58% of Chinese households said they intent to save more, with only 17% and 25%, respectively, looking to invest and spend more. Barring a fiscal stimulus or an improvement in growth outlook, this could prolong the deflationary forces in Chinese economy.
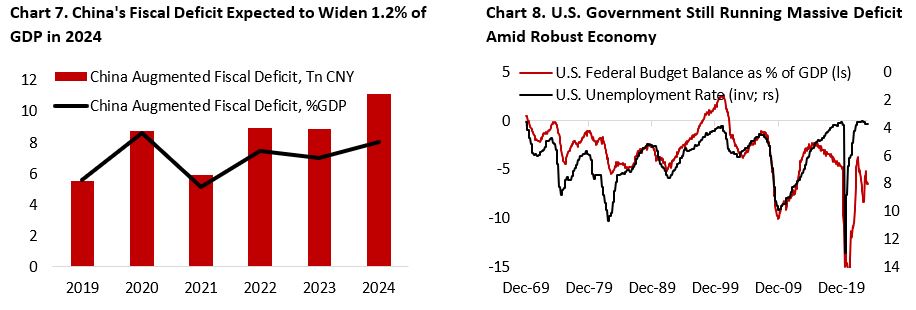
To stimulate the economy, Chinese policymakers have rolled out several rounds of fiscal and monetary stimulus over the past two years, starting from the issuance of special government bonds, rounds of MLF and RRR cut, and urging banks to lend to credit-starved sectors. For this year, China’s augmented fiscal deficit is expected to be around 8.2% of GDP, 1.2% higher than in 2023 (Chart 7). Majority of economists, however, deemed this to be inadequate to bolster growth above the 5% mark. Meanwhile, in the U.S. we are running a 6% deficit despite healthy GDP growth and tight employment backdrop (Chart 8). It is not surprising that financial conditions in U.S. have been significantly looser compared to in China and the Euro Area.
The deflationary forces in Chinese economy, however, is not all bad for the rest of the world as it should translate to lower manufactured goods prices for net importer countries – helping policymakers’ effort to bring inflation back to their target (Chart 9). Over the past 18 months we have seen Chinese goods producers aggressively taking market share in North America, with Temu – China’s version of Amazon – and Shein – a clothing retailer – reportedly accounting for a chunk of online advertising spending in the U.S.
The weaker Chinese growth outlook vs the U.S. means monetary policy divergence should continue, barring an aggressive rate cut in the U.S. in the case of a hard landing. Easier monetary policy by PBoC and the Fed remaining “higher for longer” should tilt the bias towards stronger USD/CNY pair (Chart 10). As U.S. 10-year government bond yield rose from 0.5% during the depth of the pandemic to 4.3% currently, Chinese 10-year yield has fallen further from the pandemic low of 2.48% to 2.29% currently. From Chinese investors’ perspective, this increases the attractiveness of foreign assets, minding the restriction on capital flow.

Slower global demand growth for traditional energy and base metal should also help contain headline CPI inflation from spiking higher across developed countries. This, however, will likely weigh the growth outlook of resource-dependent countries in Latin America. From a geopolitical perspective, Chinese government’s greater focus towards the domestic economy could also potentially translate to a more cordial relationship with the West in the near term.
How about Canada?
The worries on inflation and argument that growth have been resilient are not applicable with regards to Bank of Canada’s rate cut expectations. Compared to the backdrop of stickier inflation in the U.S., Canada’s February inflation data continues to head lower. Headline and core CPI inflation in Canada have fallen to 2.8% y/y in February, CPI-X (excluding volatile times) is at 2.1%, and the trimmed mean CPI has also fallen to 3.2% y/y from 3.4% the prior month, reflecting broad based disinflation across categories (Chart 11). Excluding shelter, headline CPI inflation is already running below BoC’s 2% target, while core CPI is also below 2% in February on a 3-m m/m annualized basis.
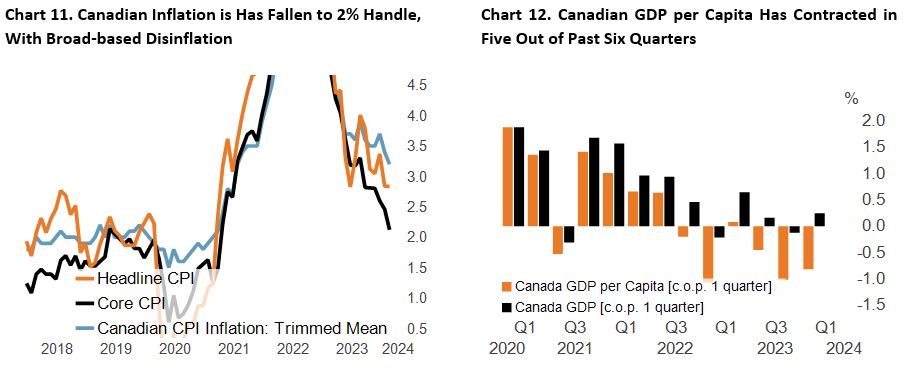
Strong immigration into the country is also masking the underlying weakness of Canadian economy. On a per capita basis, Canada have seen contraction in five out of past six quarters (Chart 12). This is why the average Canadian has a negative sentiment towards the economy and is cutting on their spending. For mortgage-holders, the situation is even worse. From a pure economic perspective, it does not make sense for the average Canadian to purchase their home compared to renting at current prices and mortgage rate. For instance, in Toronto, a two-bedroom condo in the Harbourfront area costs C$2.550 a month in rent, whereas the same unit size in the same building is available for sale at C$890.000. This means assuming 20% downpayment (C$178.000) and 25-year amortization period, at the current mortgage rate of 5.6%, the monthly mortgage payment of purchasing the unit will be around $4.387. This excludes the monthly condo maintenance fee and annual property taxes, which could add $700-1000 per month. Comparing the all-in-cost (both excluding electricity, wifi, and water bill), this translates to C$2.550 for renting vs $5.000-ish for buying. This means the landlords in that building likely have negative cash flow on the property and look only for the potential gain from rising property prices. From the landlord’s perspective, even before subtracting for the monthly condo fee, property and income taxes, the yield on this property is a paltry 3.4% – not very far from the current yield of Canadian government 10-year bonds. However, this does not mean that Canadian housing price is set to crash, as there is a multi-year structural supply/demand mismatch in residential real estate that is unlikely to be solved anytime soon.
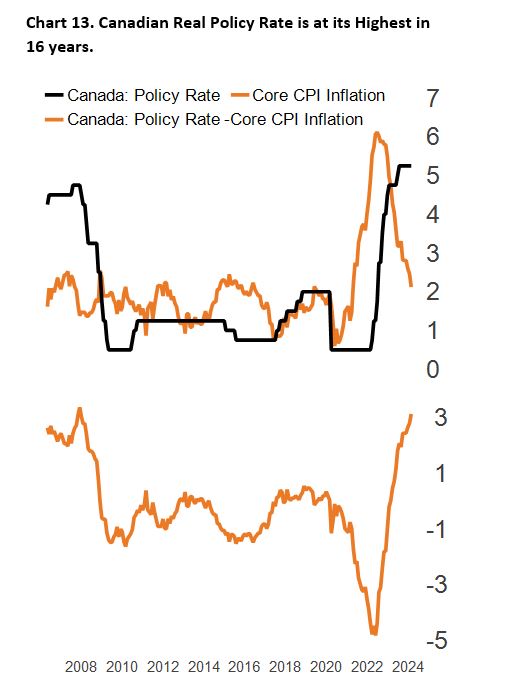
It is increasingly likely that the Bank of Canada is already late in its rate cutting cycle, which increases the probability of harder slump in consumer spending and induce an avoidable pain in the labour market. Again, consider that the economy is already contracting in five out of past six quarters, CPI-X at 2.1%, and GDP growth is forecasted to be sub-1% this year. Real policy rate at 3.1% – a 16-year high and among the highest in developed economies – seems high from this perspective (Chart 13, 14). The market is currently still pricing only 3 rate cuts by the BoC this year, similar to as in the U.S.
The main street is also seeing the lagged impact of tighter monetary policy taking its tolls, as bankruptcies have risen with business bankruptcies currently double the amount pre-pandemic (Chart 15). It is perhaps unsurprising that the bulk of employment gains of late have been dominated by part-time workers, which historically had been the case when the outlook for the economy deteriorated (Chart 16).

The bottom line is that the Canadian economy is in a much tougher spot compared to the U.S., which warrant an earlier and more aggressive rate cut by the Bank of Canada. This should translate to a more favourable outlook for Canadian bonds, although the loonie will likely weaken against the greenback if the relative growth outlook too the U.S. continues to widen.
Where To Go from Here?
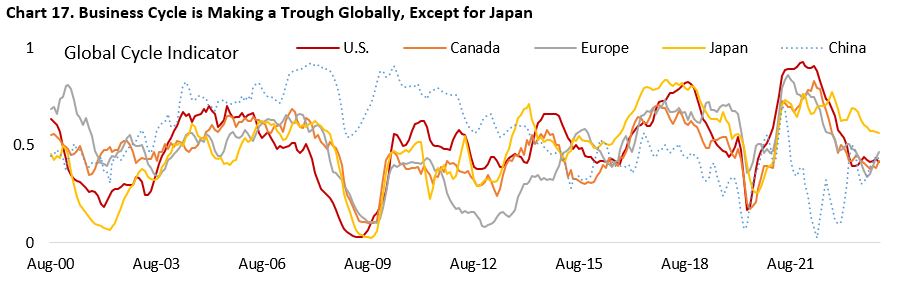
Our thesis of a cyclical recovery continues to play out over the past quarter, as manufacturing PMIs are making across major economies and leading indicators slightly improved (Chart 17). Following two years of contraction in the more cyclical part of the economy, the outlook for these sectors is starting to improve. Our list of worries is now shifting towards the consumer sector, where the labour market continues to ease, albeit very slowly and still at a healthy level, and Americans are showing signs of strain. For instance, real retail spending has contracted and greater share of credit card holders are paying only their minimum balance.
The macroeconomic condition in the U.S. currently is still favourable for risk assets, but the upside potential in equities and credit spread is narrowing. A high-frequency indicator of U.S. economic growth, Dallas Fed Weekly Economic Index continues to point to a positive but slightly below trend growth. Due to its large consumer sector (70% of GDP) and diversified domestic economy, the U.S. economy is relatively less sensitive to weaknesses in the rest of the world – unlike emerging market economies and other countries whose economy relies on exports to the developed world. Contrast this with copper-to-gold ratio, a barometer of global GDP growth, which has continued to trend lower to a level that is consistent with previous business cycle downturn (Chart 18). The resilient U.S. economy but faltering growth in the rest of the world mean higher-for-longer stance by global central banks will likely translate to more pain going forward for countries whose growth outlook this year is already below historical trend.
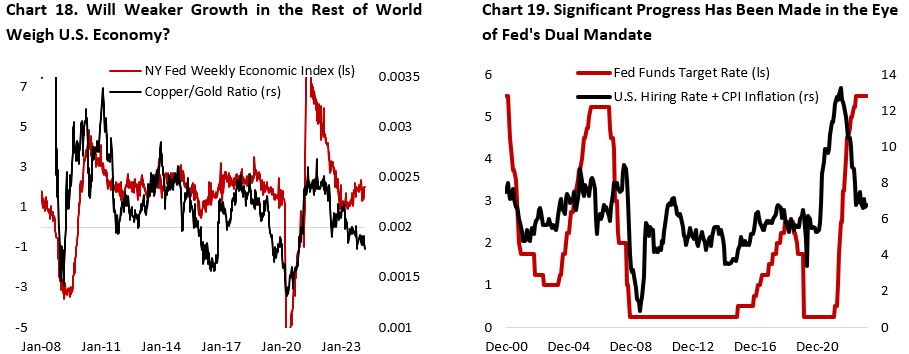
Inflation, the key theme for investors over the past three years, will likely continue to dominate investors’ focus (Chart 19). U.S. PCE inflation has fallen to 2.4% y/y in February from the high of 7.1% in June 2022. Core PCE inflation, Fed’s preferred inflation metric, has fallen to 2.8% y/y from 5.6% in February 2022. However, given that supply-side has improved markedly over the past three years and almost fully normalized, we should probably not rely much on it to drive the downward pressure in prices. This means the heavy lifting of lowering inflation will have to come from slower consumer demand and business investment on the goods side.
Encouragingly, leading indicators and data continue to point to several disinflationary forces ahead, with PCE inflation – Fed’s preferred inflation gauge – currently already in a 2%-handle. First, as discussed above, we see goods prices should remain contained amid the deflationary slump coming out of China and slowing consumer spending in the U.S. Second, wage growth is moderating, with workers no longer quitting their job and negotiating higher wages. In fact, quit rates have declined to a level consistent with prior business cycle downturn, which historically translated into lower service ex-housing inflation. Lastly and most importantly, actual rental inflation has been falling sharply (Chart 20). Given the large weights of shelter inflation in the CPI basket (>30%), this should fuel further disinflation in the headline CPI for the coming 9 months (Chart 21).

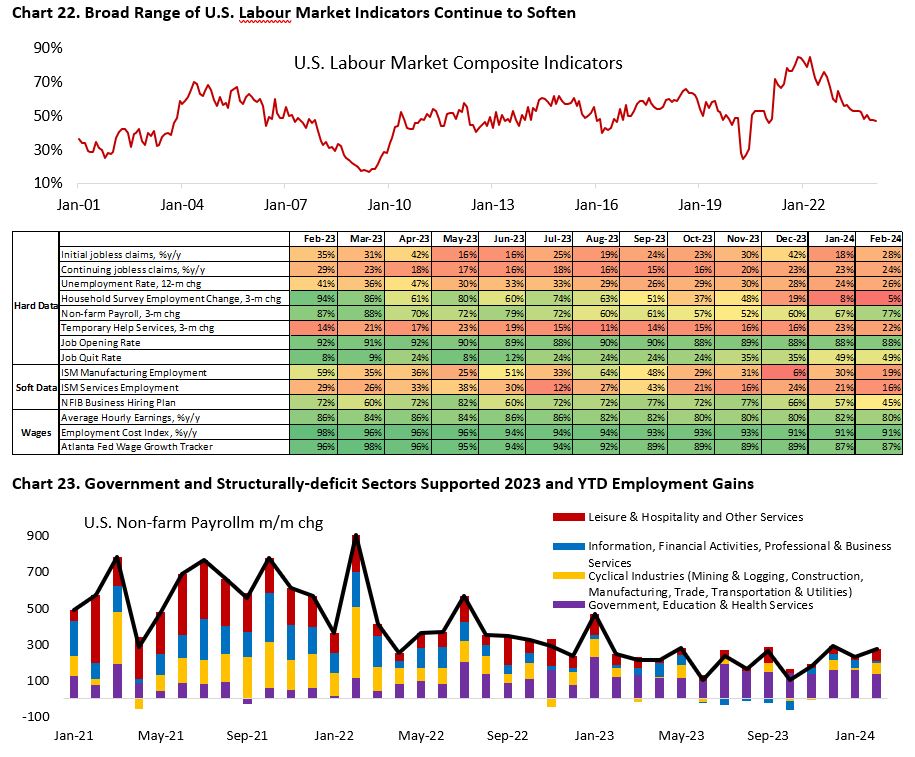
Meanwhile, the U.S. labour market continues to ease across wide varieties of indicators we tracked (Chart 22). Despite the strong read from the initial read of non-farm payroll data, subsequent revisions have been consistently lower, and households’ employment have contracted for several months in a row – a worrying divergence that may hint workers taking additional work to meet their household expenditure. In addition, temporary help services have been contracting on annual basis since December 2022 and hiring rate has fully normalized. Note that the composition of job additions is also increasingly dominated by government, education, and health care employment – sectors where structural deficit is well-known and whose demand tend to be inelastic (Chart 23).
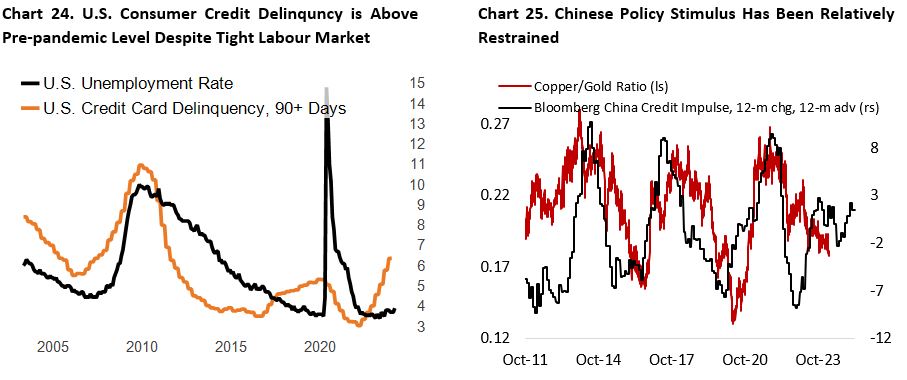
The backdrop of easing labour market and consumers pulling back on their spending point to a further deceleration in the consumer sector going forward, even as manufacturing and other cyclical part of the economy likely to accelerate. Worryingly, U.S. consumer’s credit delinquencies are already above pre-pandemic levels despite tight labour market and robust growth (Chart 24). NY Fed/Equifax data shows that 6.4% of consumer credit card loans have transitioned into serious delinquency (90+ days) compared to 5.3% prior to the pandemic. It likely only takes a slight uptick in unemployment rate for this number to rise further.
The pain for consumers, however, is not evenly distributed. Data shows that younger and lower income households are taking much of the brunt from higher prices and easing labour market. First, the uptick in U.S. unemployment rate is coming mainly from the 16-24 age group of workers, whose majority is in the lower income bracket. Consumer surveys by the Fed highlights a quicker and more material deterioration in employment confidence for workers earnings less than US$ 50.000 annually (Appendix 9). Second, younger workers also experience higher credit delinquency rate, especially in both credit card and auto categories.
It is unsurprising that retail spending has been slowing at a faster pace over the past two quarters – likely resulting from the easing in labour market and drain in excess savings. Kraft Heinze, PepsiCo, McDonald’s, and Target have all warned that rising prices has been or is expected to translate to lower volume growth, with consumer behaviour reverting to pre-pandemic norms. On the higher-income segment, consumers have also been trading down to cheaper alternative, with demographic earning over $125.000 being the fastest-growing segment, said Dollar Tree CEO. On the more discretionary side, travel spending is also being cut back. Marriott, a hotel operator, and Expedia, an online travel company, are seeing lower revenue growth this year. Lululemon and Nike’s stocks have also taken hit following weaker-than-expected revenue guidance this year as consumers tighten their belt. Given that the bulk of consumer spending is supported by the higher income segment, the strength in headline retail spending and household expenditures could be masking a weaker underlying for consumers in the 0-75th income percentile.
But it’s not all doom and gloom. The U.S. economy today is in much better spot than even an optimist expected a year ago, and U.S. consumers have been holding on. Oil prices have so far well-behaved, trading in the range of $65-85/bbl despite the unfavorable geopolitical environment in the Middle East and Russia-Ukraine war. As the U.S. election is coming closer, the risk from nationalist policy and hawkish rhetoric’s on China from both democratic and republican candidates is rising. This could force the latter to turn more inward and bolster its policy stimulus to strengthen and protect its domestic economy (Chart 25).
From asset allocation perspective, the softer growth outlook, continued progress on disinflation and softening job market all still point to a more favourable risk/reward tradeoff for bonds relative to equities, especially as concentration risk and expectation for U.S. stocks are elevated. Risk premium across corporate bonds and equities are at the lowest level in years, which makes indiscriminate buying of stocks and bonds less appealing. This is an environment where active managers should excel. Investors could also substitute their beta exposure with portable alpha through the diversification into long/short and market neutral managers, or through multi-strategy mandates with low correlation to the market.
Copyright © 2024, Putamen Capital. All rights reserved.
The information, recommendations, analysis and research materials presented in this document are provided for information purposes only and should not be considered or used as an offer or solicitation to sell or buy financial securities or other financial instruments or products, nor to constitute any advice or recommendation with respect to such securities, financial instruments or products. The text, images and other materials contained or displayed on any Putamen Capital products, services, reports, emails or website are proprietary to Putamen Capital and should not be circulated without the expressed authorization of Putamen Capital. Any use of graphs, text or other material from this report by the recipient must acknowledge Putamen Capital as the source and requires advance authorization. Putamen Capital relies on a variety of data providers for economic and financial market information. The data used in this publication may have been obtained from a variety of sources including Bloomberg, Macrobond, CEIC, Choice, MSCI, BofA Merrill Lynch and JP Morgan. The data used, or referred to, in this report are judged to be reliable, but Putamen Capital cannot be held responsible for the accuracy of data used herein.
