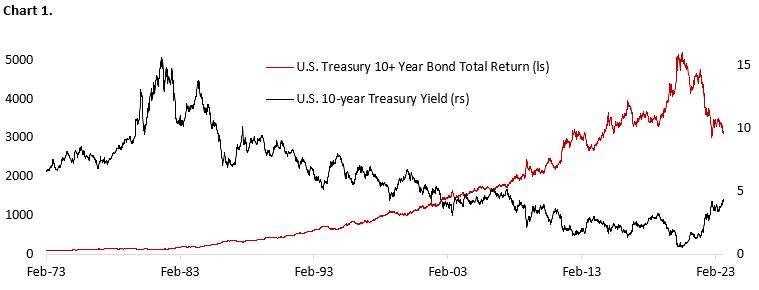
The structural decline in long-term yields since 1980 until the covid-19 pandemic had been accompanied by investors complaining that the search of attractive investment opportunities was becoming more difficult over time. The decline in borrowing cost also has a significant ramification for global investors, including boosting stock buyback amid lack of investment opportunities, breeding of the start-up ecosystem, and the proliferation of alternative assets, among others. Although coupons on bonds fell throughout the decades, bond investors were well-rewarded by the appreciation in bond prices amid the lower yield environment.
Over the past 18 months, however, those same investors have been nursing losses on their fixed income portfolio amid the sharp increase in global inflation and policy rate. It is understandable that investors would now prefer to put their money on cash – yielding over 5% – and shy away from taking duration risk given the elevated market uncertainty, but the bond market is now providing investors with the opportunity to lock in long-term returns at levels not seen in the past sixteen years (Chart 1).
For liability-driven managers, the current higher yield environment is good news as the present value of their liabilities shrink and higher bond yields allow them to lock in returns that match their future liability requirement. Not only that, but long duration is also a hedge for investor’s exposure to risk assets, which limits downside risk should recession materialize. The higher returns offered by fixed income also means investors have less need to chase the more exotic investment opportunities offered by alternative assets to meet their investment goals.
Given that yields are now at the highest levels since the global financial crisis (GFC), the relevant question is whether the factors that had been driving yields lower over the past four decades have reversed. Arguably, global population growth is still slowing, with the share of population age 65 years old and above growing materially. Meanwhile, technological advancement continues to surprise positively, as highlighted by the recent positive development on AI that could revolutionize medical diagnosis and treatment, advanced computing, and other scientific development – including the way scientific breakthrough could be made. Both trends are deflationary in the long run.
As portfolio managers, however, we don’t have the luxury to take the very long view. In general, our tactical positioning is in anticipation of the market moves 3-12 months ahead. Much of our focus currently is on the trajectory of inflation, central bank policy and the outlook for global economy in 2024. Whereas recession was the consensus view and investors took a defensive tilt at the beginning of 2023, the contrary is true now amid year-to-date rally in equities and disappointing bond returns (Chart 2).

Although U.S. consumer spending continues to be robust and we are expecting a bottom of cyclical sector activity in the current quarter, it is too early to dismiss the potential for recession in the U.S. given the lagged impact of monetary tightening over the past 18 months. Moreover, the equity market is already pricing in aggressive growth in earnings over the next 12 months amid FY24 GDP growth consensus moving lower, and equity multiple is not cheap despite elevated yields. These all point to an unfavorable risk/reward trade off, especially for U.S. stocks, in our view.
Market Continues to Push Probability of Rate Cut (and Recession) into The Future
The better-than-expected growth this year, especially in the U.S., have been a tailwind for the equity market to rally sharply amid a depressed expectations at the beginning of the year. GDP growth estimates for U.S., Canada, and Eurozone have all risen compared to in January, with U.S. leading the upward revision (+1.7%), followed by Canada (+0.9%) and Eurozone (+0.7%). However, at the same time, economists are also revising down FY24 GDP growth estimates to below 1% for all three economies (Chart 3). In short, despite the consensus calling for no recession in the next 12 months, we are not out of the woods just yet.

The same message could be found in market pricing of Fed funds target rate. Following the through in long-term yields in early April amid regional banking crisis, the bond market has subsequently priced out the probability of rate cut this year and pushing the long end of the curve higher (Chart 4). This is the reason investors continue to feel the pain from higher yields over the past two months despite the Fed not expected to raise rate further in the current cycle. With the market already pricing in no recession scenario, there could be a sharp rotation into bonds and defensive equities if growth and inflation data surprised negatively in the coming months.

The likelihood of mean-reversion back into defensives and lower bond yields is also increasing. First, inflation has been falling from as high as 9.1% to 3% handle currently. We do think there is an upside risk from the resurgence of energy prices and stickier wage inflation amid union’s wage negotiation. However, decline in housing cost inflation, used car prices, and food prices could offset the inflationary factors. Second, labour market is easing with job openings and hiring continuing to soften. Total job demand, proxied by the sum of jobs vacancy and total non-farm payrolls, peaked in the Spring of 2023 and has marginally softened since. Third, consumer spending is facing headwinds larger than had been seen over the past years. Drained excess savings, resumption of student loan payment, and higher delinquency rate and credit card utilization all should weight discretionary spending. If two out of these three factors continue their trend seen over the past year, bond yields will likely move lower from current market pricing.
Divergence in Regional Economic Cycle and Equity Composition
The different pace of economic recovery post-pandemic and the variation in policymakers’ reaction to resurging inflation mean the economies today are on different stages of the business cycle. Chart 5 shows a stylized economic cycle and where each economy is today, based on the composite percentile of various economic indicators we tracked on Chart 6 and Table 1.

China is still on the path of economic recovery following a later-than-others economic reopening in December 2022 and PBoC remains in easing mode amid the worse-than-expected growth numbers. Japan’s growth is decelerating although its economic cycle remains close to peak, supported by the very loose monetary policy by the BoJ. Meanwhile, the rest of major global economies, including Canada, is still on the downward path of the cycle. Chart 6 shows the trajectory of economic data for each region remains to the downside, although indicators for U.S. and Canada have been levelling throughout the Summer. On a rate of change basis, all economic variables in the U.S. are worsening despite the still healthy (highlighted in green) job market condition (Table 1). The 12-24 months lagged historically observed between Fed’s policy rate hike and growth slowdown means more growth headwinds are in the pipeline for 2024, potentially breaking the resilience in the labour market.


The global growth slowdown, lingering worries on China’s property developers, and differing sector weights between stock indices are also reflected in the valuation across geographies. Equity index with greater weights on the high-growing info tech, such as the S&P 500, saw higher valuation relative to other indices and its own history (Table 2). Meanwhile, indices with greater weights toward cyclical sectors (financials, discretionary industrials, energy, and materials) are trading at a significant discount. For example, Canada’s S&P/TSX Composite index, in which 77.7% of the index is cyclicals, is being valued at only 14.5 times forward earnings (22nd percentile relative to its own history).
Following 15 years of outperformance (Chart 7), it’s simply too early to brush out the strength of U.S. stocks and its tech giants, but lofty valuation and concerns on the long-term dollar outlook could potentially translate to a mean-reversal of its relative performance to rest of the world (Chart 8).

Overview of U.S Equity and Sector Strategy
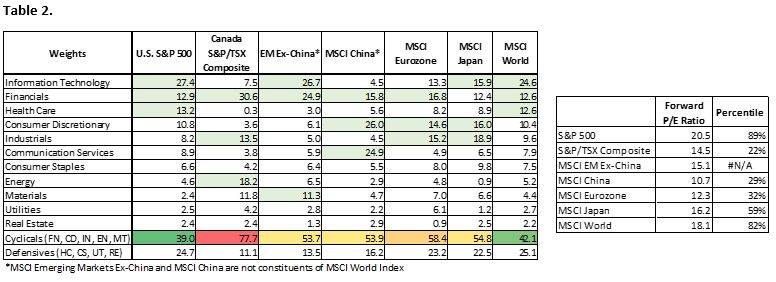
The rally in seven mega-cap tech stocks this year has driven the massive outperformance of S&P 500 and its equal weight benchmark. Roughly two-third of the gain in S&P 500 this year has been driven by seven names that account for about 30% of the index, while the rest 70% of the index delivers mainly mid-single-digit return. This is consistent with the historical periods of Fed tightening cycle where quality and growth companies tend to get bid over smaller and riskier counterparts. In fact, this outperformance could further extend if recession occur as investors coalesce around companies with strong balance sheet and defensible earnings growth, as had happened during the global financial crisis and covid-19 pandemic (Chart 9).
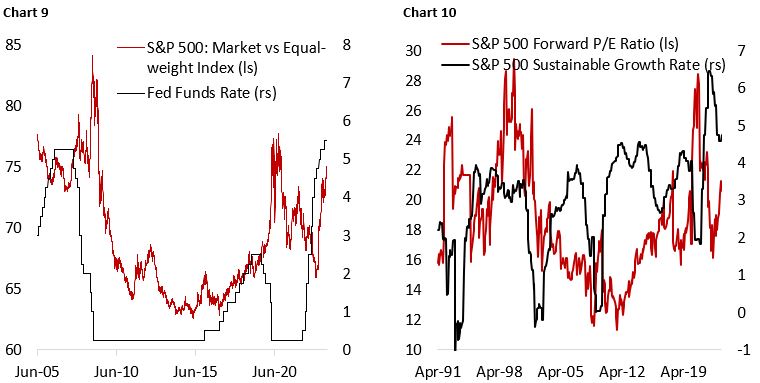
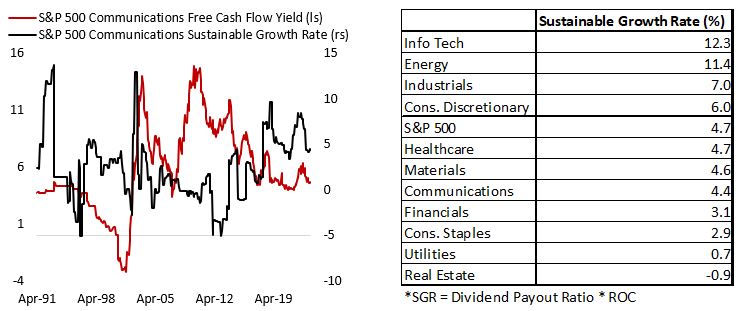
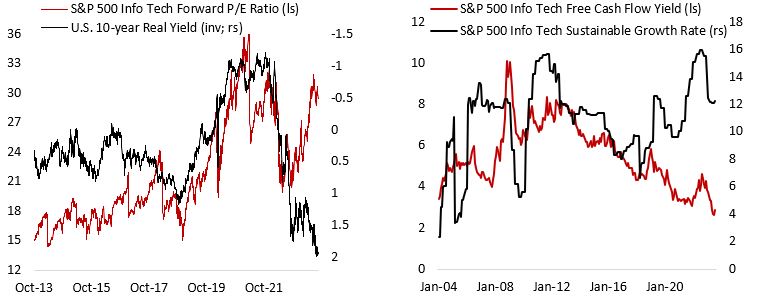
Across all metrics, valuation for the S&P 500 remains elevated amid the large contribution from high-growth, large-cap names in the technology space. More bullish investors would correctly point to the domination of the global internet advertising space by Google and Meta, e-commerce by Amazon, and Cloud by Microsoft and Google, smartphone by Apple – all of which drive higher earnings growth and may justify premium valuation for these firms. At current level of payout ratio and return on capital, we estimate the sustainable growth rate for U.S. stocks to be around 4.7% – only slightly above trend nominal GDP growth and roughly 100 bps higher compared to historical average (Chart 10). This could be partially explained by excess margin earned post pandemic as U.S. consumers spend their excess savings, and the fact that wage growth barely caught up with inflation. Given that excess savings are depleted and U.S. labour action is resurging again after being dormant for decades, profit margin for most companies would likely decline and translating into lower shareholders’ return in the coming years. In the shorter term, lower nominal GDP growth over the next 12-18 months should weigh top-line growth for the aggregate equity universe.
The higher equity valuation is interesting this year due to the backdrop of rising and elevated yields. We are cognizant of the fact that equity risk premium tends to compress as real yields move higher, but the current ERP still looks tight compared to history (Chart 11).

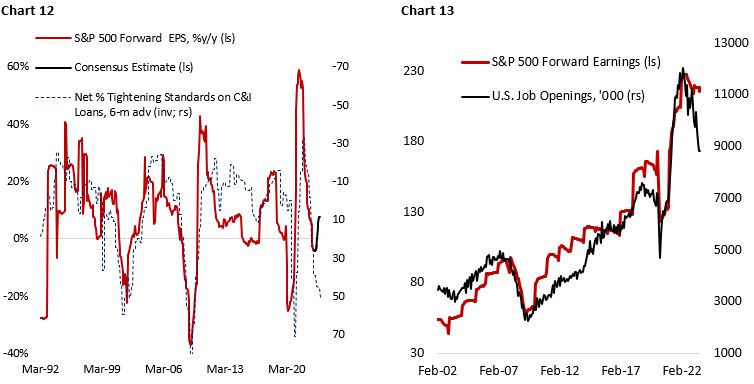
On the earnings side, consensus is expecting a bottom in Q2/23 and for earnings to move higher by mid-single-digit in the coming quarters. This is in contrast to what historically happened during periods of tightening lending standards and slower economic growth (Chart 12). In sum, market is expecting earnings to accelerate even as GDP growth decelerate and inflation to trend lower. In addition, the cooling in labour market is also pointing to weaker earnings ahead as consumers are cutting back discretionary spending (Chart 13).
Within the equity market, the rally in cyclicals and growth this year has resulted in defensive sector valuation cheapening significantly while info tech and consumer discretionary becoming even richer (Table 3 and 4). Consumer staples and utilities have flipped from being the top percentile on a relative basis to the bottom of the rank. Energy and materials remain cheap, while financials and industrials are now looking more attractive. We discuss our view on each sector in depth in the following section.

Sector Overview
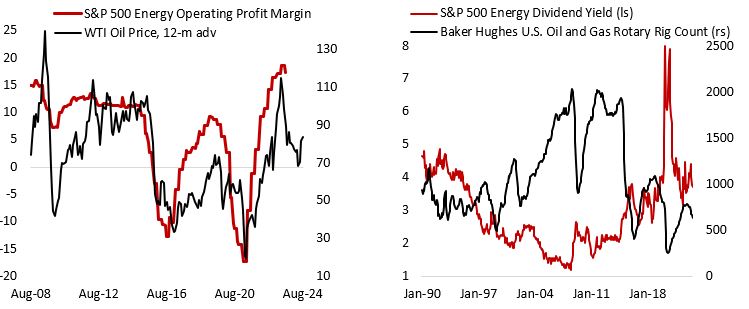
Energy – Overweight
Our thesis overweighing the energy sector is contributing positively again to the portfolio performance since the end of June, after the sector being a drag for the whole year. OPEC+ decision to extend their supply curb and relatively strong Chinese imports of oil despite its economic weakness drove oil prices back to above $85/bbl. This boosted the outlook for operating margin in the coming year, which should continue to support valuation for energy stocks. The sector is trading at 12 times forward earnings (33rd percentile), a 41% discount to the overall S&P 500 benchmark. Meanwhile, North American operators remain disciplined in their capital allocation and opt to not expand production capacity, preferring instead to boost their dividend (3.7% yield as of August 2023).
On the risk side, there are signs that elevated oil price is accelerating the transition towards electric vehicle and green energy infrastructure, which could bring forward the timeline for peak in oil demand. In the shorter-term, we remain cautiously bullish on energy prices given early signs of weakening consumer demand in the U.S. and still fragile Chinese economic recovery.
Consumer Staples – Overweight
Valuation for consumer staples has flipped from very expensive at the beginning of the year to reasonably cheap currently. The sector was trading at 26% premium (97th percentile) relative to the benchmark in January 2023 but has fallen to par today (15th percentile). On an absolute basis, forward earnings multiple declined from 22.1x (97th percentile) to 20.2x (68th percentile). The depressed earnings expectations for the sector and reasonable valuation should translate to the sector outperforming if growth conditions turn out to be weaker than consensus, which we expect.
In addition, the decline in cost inflation (transport, energy) and food prices since March 2022 amid easing agricultural exports disruption from the Ukraine war should reduce input cost for many staples name and bolster margin in the coming quarters. We remain overweight consumer staples in the portfolio.

Healthcare – Overweight
On absolute basis, valuation for healthcare sector is expensive amid the positive development on GLP-1 obesity drug that drove Eli Lilly (and Novo Nordisk) multiple much higher. LLY is now the largest stock in U.S. and MSCI World Healthcare index, whereas NVO is the fourth largest in MSCI World Healthcare index. But the sector has underperformed this year amid the fall in operating profit margin and Medicare reform proposal aiming to cap prices for 10 prescription drugs that account for the bulk of Medicare (Part D) spending. The uncertainty surrounding the negotiations will continue to weigh sentiment for pharma, pharmacy/retailer, and PBM in the near term. At the same time, companies are adapting to the potential change in regulatory environment by trimming drug trial candidates that provide inadequate returns on their R&D investment, which should translate to a healthy free cash flow yield going forward.
Healthcare sector historically provides defensive exposure in a cycle downturn and considering the potential application of AI in drug discovery and patient treatment, the sector should trade at premium relative to benchmark. Valuation for healthcare is currently elevated due to the depressed forward earnings estimates, but the sector is still trading at 8% discount (43rd percentile) relative to the benchmark.

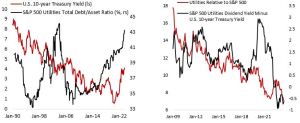
Utilities – Underweight
Utilities are among the worst underperformers this year and we have been underweight. The high-leverage nature of utility operators and the backdrop of rising borrowing cost bode poorly for the overall sector performance. Not only companies in the sector have seen a dramatic increase in debt/asset ratio, but the sector’s dividend yield is also less competitive for investors needing income. Currently, utilities’ average dividend yield of 3.5% is below those of U.S. 10-year Treasury yield at 4.4%. We would turn more positive on the sector once yields are clearly trending lower and growth conditions are deteriorating at a faster pace. On the positive note, valuation for the sector has improved materially compared to the beginning of 2023, with forward earnings multiple falling from 19.7x (89th percentile) to 17.3x (66th percentile).
Real Estate – Underweight
Similar to the utility sector, real estate significantly underperformed this year amid the problem surrounding commercial real estate. The high-leverage nature of its business and rising borrowing cost also weigh on earnings and equity valuation. Given the backdrop of rising rates, the sector’s dividend yield is also less competitive for investors needing income. Real estate sector’s dividend yield of 3.5% is below those of long-term Treasury yielding over 4% or even cash at 5% and above. While cap rate (the discount rate applied in valuing real estate assets) for office has widened to level last seen during the global financial crisis, the spread over risk-free rate is close to historical average. Meanwhile, valuation of industrial REITS is at a lofty level. The bottom line is that the outlook for real estate will hinge on the trajectory of yields and improvement in its fundamental (rental growth, vacancy rate, solvency, etc.) We remain underweight the sector and patiently wait for greater visibility of the sector fundamental.


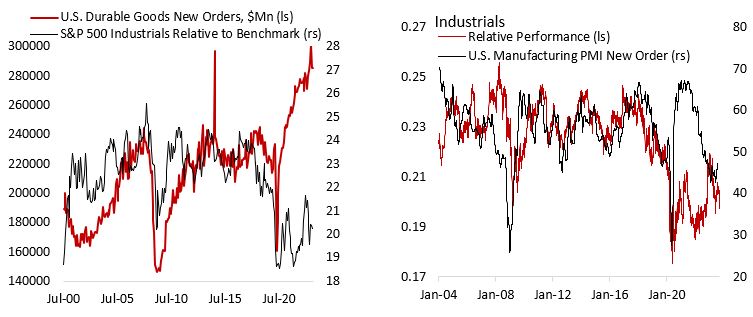
Industrials – Neutral to Slight OW
Industrial sector has underperformed this year amid global manufacturing recession and weaknesses in transportation sub-sector. Relative to the S&P 500 benchmark, industrial sector valuation has fallen from 17% premium (85th percentile) at the beginning of 2023 to 5% discount (16th percentile) currently. In the short term, lingering weakness across manufacturing sector and higher energy prices may weigh on the sector’s earnings outlook. However, in the medium-term we are becoming more constructive on the sector amid multiple U.S. government efforts to bring production onshore, which is a tailwind for durable goods demand. We brought our portfolio’s industrial exposure from underweight to neutral in September and will look for opportunities to increase it further in the coming quarters.
Communications – Neutral to Slight OW
Given the sector composition is heavily tilted towards Google and Meta whose business rely heavily on advertising revenue, the potential weakness in consumer spending bodes poorly for the sector. However, the sector’s sustainable growth rate and cash flow yield remains attractive, and valuation is not too stretched. We maintain neutral on the sector. The structural shift from cable to streaming is also having a mix effect on the sector, as Google and Netflix are gaining from it but slightly offset by traditional players, including Disney.
Consumer Discretionary – Underweight
Valuation for consumer discretionary sector remains rich, with the market-cap weight index heavily tilted towards Amazon (30% of the sector) and Tesla (17%). The rest of the sector is much weaker, with Home Depot and homebuilders rolling over after at strong beginning of the year. Meanwhile, the rest of the sector is tightly linked to the health of consumers. We are cautious on the outlook of consumer spending amid the drain in excess savings, student loan repayment in October, and easing labour market conditions. Although the hard data indicates a still healthy U.S. growth outlook this year, we have yet to see the bulk of impact from monetary tightening over the past 18 months. We remain underweight the sector.

Materials – Slight UW to Neutral
The tug-of-war between increased structural demand for base metals amid the transition to renewables and EVs and decelerating global growth leaves the material sector directionless on a relative basis. Earnings expectations for the sector have been downgraded significantly over the past year, and valuation is reasonably attractive, on par with historical average on absolute basis and cheap relative to the benchmark. We are looking for a green shoot in German industrial complex and the broader Chinese economy before adding to the sector.

Info Tech – Underweight
The info tech sector is the most expensive sector in the S&P 500 benchmark on both relative and absolute basis, trading at 29x forward earnings (93rd percentile) and 43% premium relative to the benchmark (93rd percentile). The sector performance has been supercharged by the good news surrounding AI development, translating to AAPL, MSFT, and NVDA together account for over 50% of the MSCI World and S&P 500 Info Tech Index. In the longer run, we believe the sector will continue to outperform the benchmark given the high sustainable growth rate (retained earnings times return on capital) and decent free cash flow yield. However, the froth in valuation despite higher yield backdrop should weigh the sector going forward. We remain underweight info tech in our portfolio.
Financials – Slight UW to Neutral
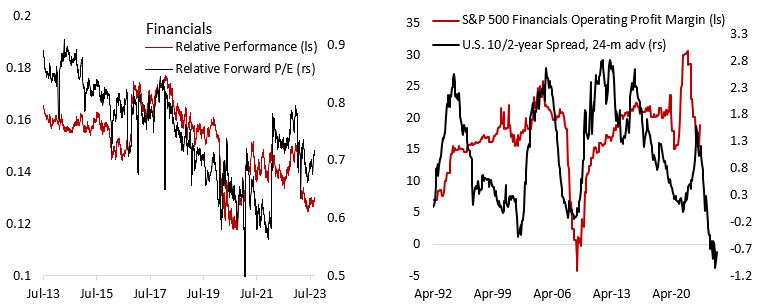
As historically been the case, financial sector has underperformed the benchmark this year amid the regional banking crisis that erupted last March. The underlying fundamental drivers for the banking sub-sector have not changed much since. Inverted yield curve and elevated nominal yields are pushing competition for deposits higher, especially among the smaller banks, while banks themselves are tightening lending standard and raising spread over the cost of funding in expectation of increase in credit risk. Auto and credit card delinquencies are now above pre-pandemic levels, and smaller businesses are reporting greater financing difficulty. In addition, rising yields should translate to further losses in banks’ fixed income assets classified as available-for-sale and held-to-maturity.
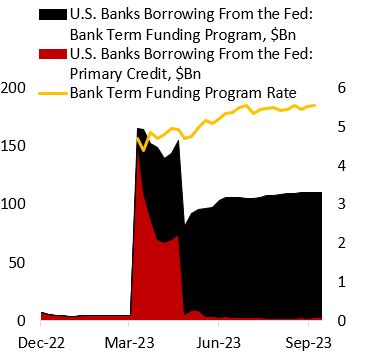
In the U.S. regulators are looking to increase the capital requirement for non-GSIBs, which will further pressure their profitability. U.S. banks borrowing from the Fed remains high and rising, despite its expensive cost. On the positive note, the inclusion of payment processors into financial sector benchmarks this year has diversify the concentration of banks in the index, and the sector valuation is attractive relative to the benchmark. We remain slightly underweight financials in our portfolio.
Copyright © 2023, Putamen Capital. All rights reserved.
The information, recommendations, analysis and research materials presented in this document are provided for information purposes only and should not be considered or used as an offer or solicitation to sell or buy financial securities or other financial instruments or products, nor to constitute any advice or recommendation with respect to such securities, financial instruments or products. The text, images and other materials contained or displayed on any Putamen Capital products, services, reports, emails or website are proprietary to Putamen Capital and should not be circulated without the expressed authorization of Putamen Capital. Any use of graphs, text or other material from this report by the recipient must acknowledge Putamen Capital as the source and requires advance authorization. Putamen Capital relies on a variety of data providers for economic and financial market information. The data used in this publication may have been obtained from a variety of sources including Bloomberg, Macrobond, CEIC, Choice, MSCI, BofA Merrill Lynch and JP Morgan. The data used, or referred to, in this report are judged to be reliable, but Putamen Capital cannot be held responsible for the accuracy of data used herein.
