Download PDF: Market Responses During Periods of High Inflation
Recent crisis in Argentina and Turkey have left me wonder, why does equity markets in local currency terms always corrects during periods of high inflation although in the medium-term corporates are able to maintain their margin through gradual increase of price of their products? My logic tells that higher inflation should translate to higher equity prices in local currency terms, instead of the reverse that we have seen repeatedly in the past decades. Using a simple reverse-engineering of DCF model, stock price and cash flow projection, we could calculate the equity risk premium priced-in by the market during the crisis. However, it is not a straightforward process as negative earnings could render ratios such as earnings yield meaningless.
Previous crisis is often exacerbated by excessive borrowing in hard currency, causing a mismatch of currency denomination between revenue and interest payment, and most often triggered by currency collapse, the original sin of many EM countries in the 1990’s. Overall, it took between 2-4 years for the recovery to take place and investors should monitor few indicators to time the bottom of the recession. Ideally, we want to see inflation softening combined with declining net debt/EBITDA ratio, increasing margins and improvement in cash from operations.
In this review, we looked at previous high inflation periods since 1995 in various countries: Argentina, Indonesia, India, Turkey, Mexico and Brazil. Investors harvesting the risk premium during the bottom of such tumultuous periods in the Emerging Market countries have been historically richly rewarded.
Kevin Yulianto, CAIA, PFM
Chief Investment Officer

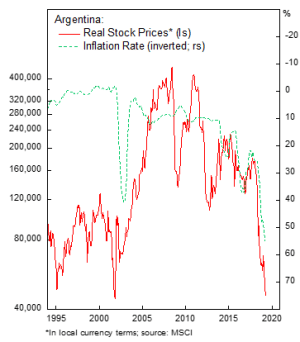
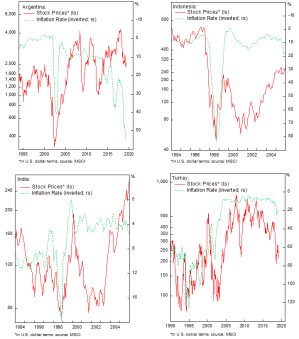
Argentina (2002-2003 and 2016-Now)
The current Argentine crisis impact to corporate profit is not as severe as the one in 2002-2003, yet the market response is as dramatic. In 2002-2003 crisis Argentine real stock price dropped 65% from its peak in 2000 and the debt to Enterprise Value increased above 80% (nearing insolvency), in contrast with the 80% price drop and 40% Debt/EV ratio in current crisis that began in 2016.
Earnings power, measured by cash from operations, dropped only by 32% in the current crisis vs above 95% in 2002. Structurally, Argentine firms’ balance sheet has also been much more robust as a result of previous crisis. Hence, companies are still able to service their debt: currency mismatch is minimized, and higher portion of the rising cost is passed on to consumers. In this light, we are bullish on Argentine equity and expect that once the earnings momentum build as inflation slows, equities will have a sharp rally in the next two years.

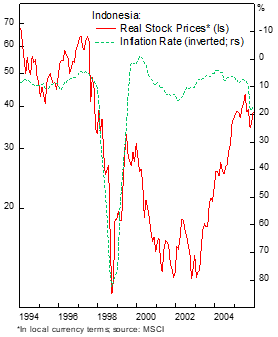
Indonesia (1998-1999)
The Asian crisis in 1998 impact to Indonesian economy is still widely discussed today and has resulted in a conservative balance sheet of majority of Indonesian public firms, there were even arguments that Indonesian firm should increase their gearing to invest in more profitable projects rather than paying dividends or having substantial amount of cash in their balance sheet.
In real terms, the stock price dropped 82% from the top and operating profit margin turned negative due to USD-based cost in the operating structure as managers rely on cheap dollar funding and stability of Rupiah’s peg to the USD in the preceding years. This complacency has brought down even large national firms and resulted in insolvency for most public companies (Debt/EV is reaching 100%). As cash from operation turned negative, there is no other way for businesses to survive. Liquidation is occurring in every sector of the economy and created a second and third order effect in the years after, hampering the recovery.
Today, Indonesian public firms are among those with stronger balance sheet and decent return, the reason multiples are higher than average Emerging Markets.

India (1998-1999)
The 1998 crisis has a milder impact to Indian corporates, real stock price dropped 42% (half of Indonesian stocks) and profit margin in aggregate stays positive. Meanwhile, debt to EV doubles, more due to the fall in equity value rather than due to the increase in translation of hard-currency debt. Indian corporates were relying less on hard currency borrowing in their capital structure; hence the rupee depreciation has a less severe effect compared to Indonesian.
Ironically, in the next two decades, Indian corporates profitability and governance has deteriorated: profit margins are declining and net debt to EBITDA ratio has been creeping higher, at a rate above Emerging Markets average. This is another important point to observe on the crisis recovery process: drastic crisis often alters the capital structure and improve governance of public companies, leaving the overall private sector more robust afterwards.
On a separate note, the declining profitability and relatively high debt level seem to put Indian corporates at risk of multiples de-rating in the years ahead.


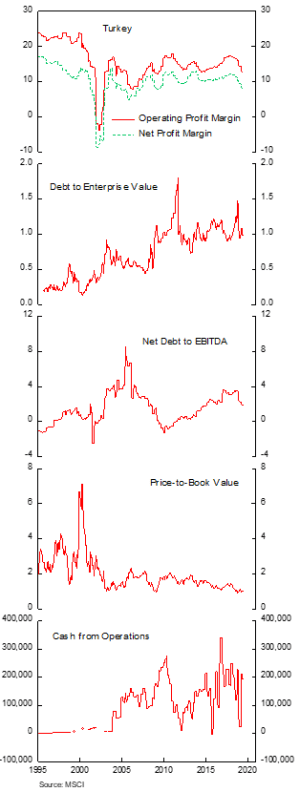
Turkey (2000-2003 and 2018-2019)
Turkey’s recent crisis is the original cause of my inspiration for this post. As the recovery is underway, I wonder on how equity market response during the past recovery process and what indicators should be monitored to see the turning points. In the crisis that began in 2000, in real terms, Turkish equity dropped 72% from the peak, in contrast to 36% fall last year.
During the 2000’s even EBITDA turned negative for the corporate averages as the cost structure was heavily depended on the dollar. Last year, Turkish corporate margin has dropped somewhat, but not to a level that was the case in the 2000 crisis.
Currently Turkish P/B value is at a level seen in the bottom of 2003 and 2008 crisis, after dropping slightly below book value late last year, an indicator that it has cheapened enough. Moreover, net debt to EBITDA has been falling since Q4 last year, an indication that the effect from restructuring has been going in the right direction.

Mexico (1998-1999)
Although Mexico is infamous for its Tequila crisis in 1995, unfortunately we do not have comprehensive data for the period, leaving us to scrutinize the crisis of 1998 instead. Mexican equities were falling 40% in real terms and debt to EV ratio shot to 50%. These were a rather mild impact from the crisis, as the country has suffered through a cleansing process that removes most of the froths in the market during 1995 crisis. For that reason, net profit margin was converging to operating margin as there were very little debt in the balance sheet: Mexican corporates were able to pay all their debt using cash and earnings in 1.3 years.
Since 2008, however, Mexican firms’ profitability has been declining and firms have been levering up, bringing the net debt to EBITDA ratio closer to EM average. The market is still attractive from global point of view with less demanding valuation than historical average, but investors should caution against the build up in debt level and falling competitiveness of Mexican labor relative to Emerging Asian economies.


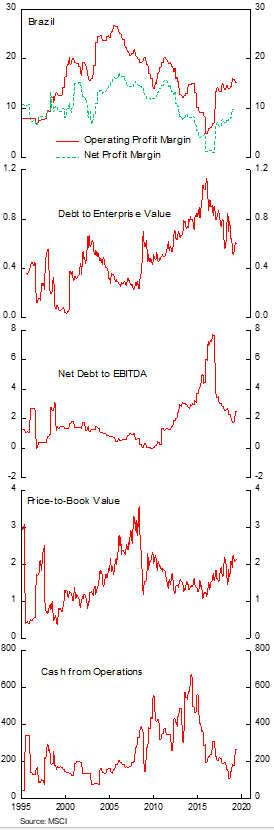
Brazil (2002-2004 and 2015-2016)
In real terms, Brazilian equities corrected by 26% in 2002 crisis and 41% in 2015 crisis. The crisis was milder compared to the Asian crisis with several observation in order: margins dropped during the period, but corporate earnings were still positive on aggregate and cash from operations stayed positive throughout the whole period. The 2015 crisis, however, managed to push GDP dropped 4% vs staying slight positive in 2002. The severity could also be seen in the spike of debt to EV ratio above 100% in 2015.
Brazilian recovery since 2015 has been rather slow; although debt/EV ratio has been falling, growth in cash from operations remains tepid. It remains to be seen whether Brazilian firms restructuring efforts are able to boost the bottom line, but there is an increasing probability that it will be the case as debt ratio continues to fall and corporate’s ability to service their debt is increasing. All this will continue reduces the interest burden and default risk premium priced in the market, the reason Brazilian equities have more than doubled in U.S. dollar terms since early 2016 and should continue its upward momentum as bottom line earnings improves.

Inflation and Stock Prices in US$ Terms

Copyright © 2019, Putamen Capital. All rights reserved.
The information, recommendations, analysis and research materials presented in this document are provided for information purposes only and should not be considered or used as an offer or solicitation to sell or buy financial securities or other financial instruments or products, nor to constitute any advice or recommendation with respect to such securities, financial instruments or products. The text, images and other materials contained or displayed on any Putamen Capital products, services, reports, emails or website are proprietary to Putamen Capital and should not be circulated without the expressed authorization of Putamen Capital. Any use of graphs, text or other material from this report by the recipient must acknowledge Putamen Capital as the source and requires advance authorization. Putamen Capital relies on a variety of data providers for economic and financial market information. The data used in this publication may have been obtained from a variety of sources including Bloomberg, Macrobond, CEIC, Choice, MSCI, BofA Merrill Lynch and JP Morgan. The data used, or referred to, in this report are judged to be reliable, but Putamen Capital cannot be held responsible for the accuracy of data used herein.
