The U.S. economy seems to continue its resiliency following the tariff-related distortions during the first and second quarter of 2025, with the preliminary reading of Q3/25 GDP showing the U.S. economy growing 4.3% q/q annualized. Consumer spending accelerated in Q3/25 while business investment and government spending remained healthy, alleviating concerns that the softening in U.S. labour market will drag down the overall growth picture. But we know that within the consumer spending category, there has been an increasingly uneven distribution of expenditures by the majority of Americans and those in the top 10% of households by income. The bottom half of consumers have pulled back on spending – with one out of four Americans is reported to use buy now pay later in the past twelve months – and will likely remain weak in 2026 while spending by the top 10% of households should stay robust amid rising home equity value and stock market – translating to a more favourable outlook for companies catering to this segment of the population.
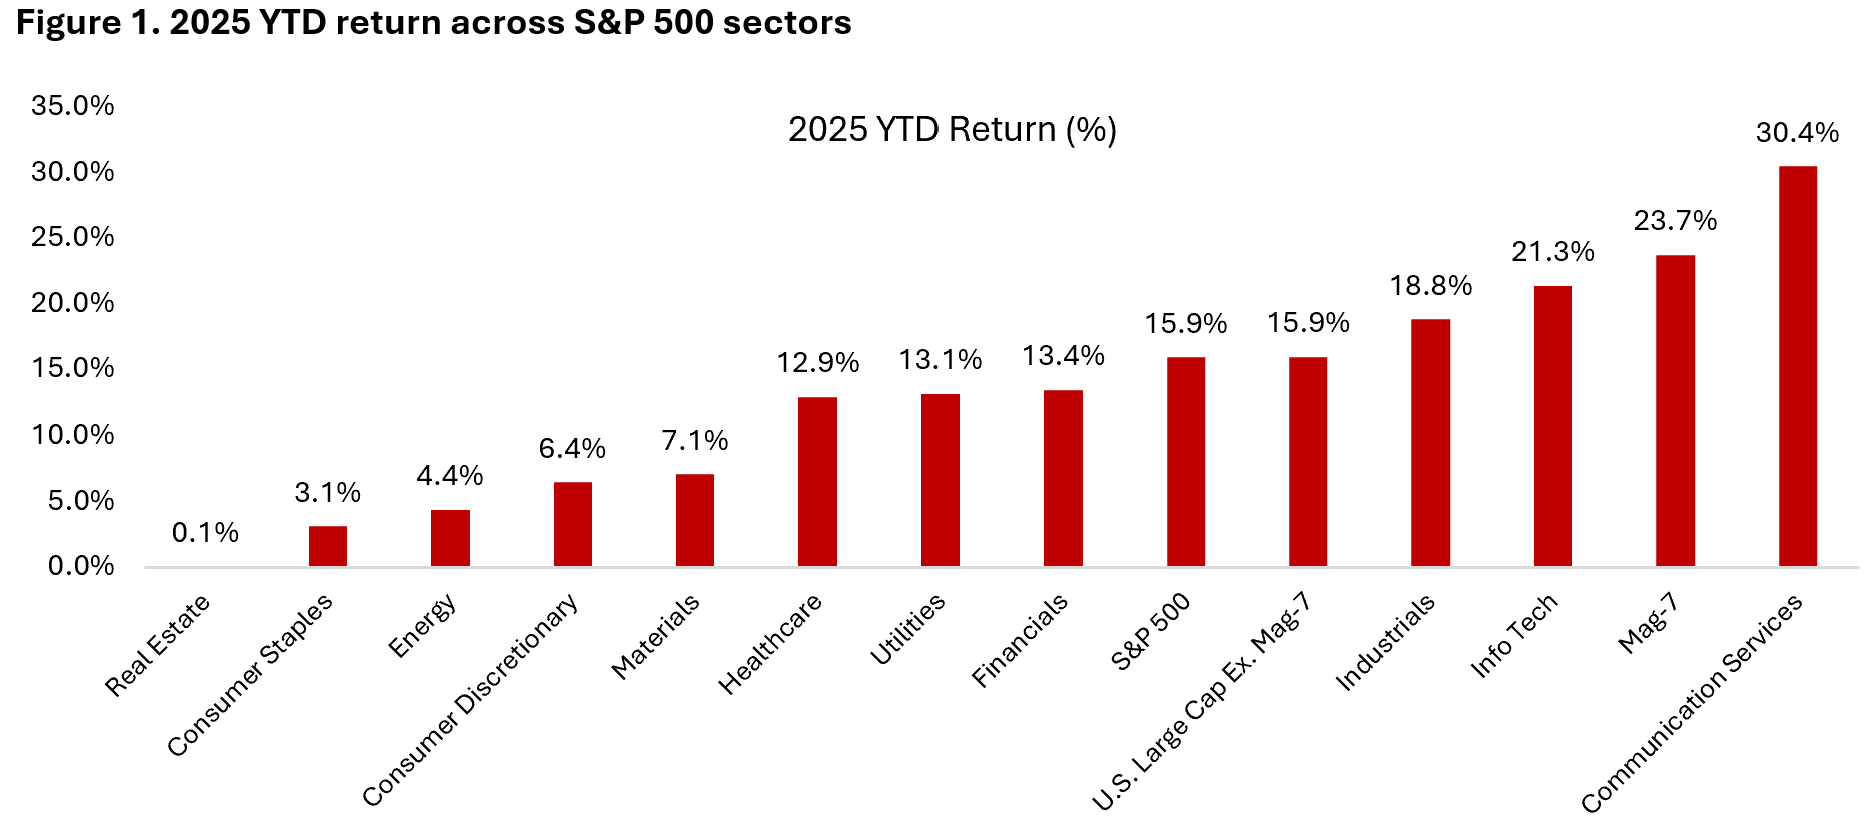
Majority of consumer-related stocks have corrected heavily in 2025 as labour market weakness have translated to a pullback in spending by households in the bottom half of the income distribution. Consumer staples sector is among the worst-performing sector in 2025 and select retailers have also feel the brunt (Figure 1). Brands and categories that have enjoyed a boom in pricing power and volume growth between 2020 and 2023 have seen tough comparison this year and normalization of margin (lower), including bellwethers such as Lululemon and Nike. On the other hand, revenue growth of tier-1 luxury brands (RMS, LVMH, CFR) seems to have bottomed and set to accelerate in 2026, supported by the sharp increase in financial assets value of higher-income households. If the U.S. labour market holds, many of the beaten-down consumer stocks could stage a rebound sometimes next year, for reasons we will discuss below.
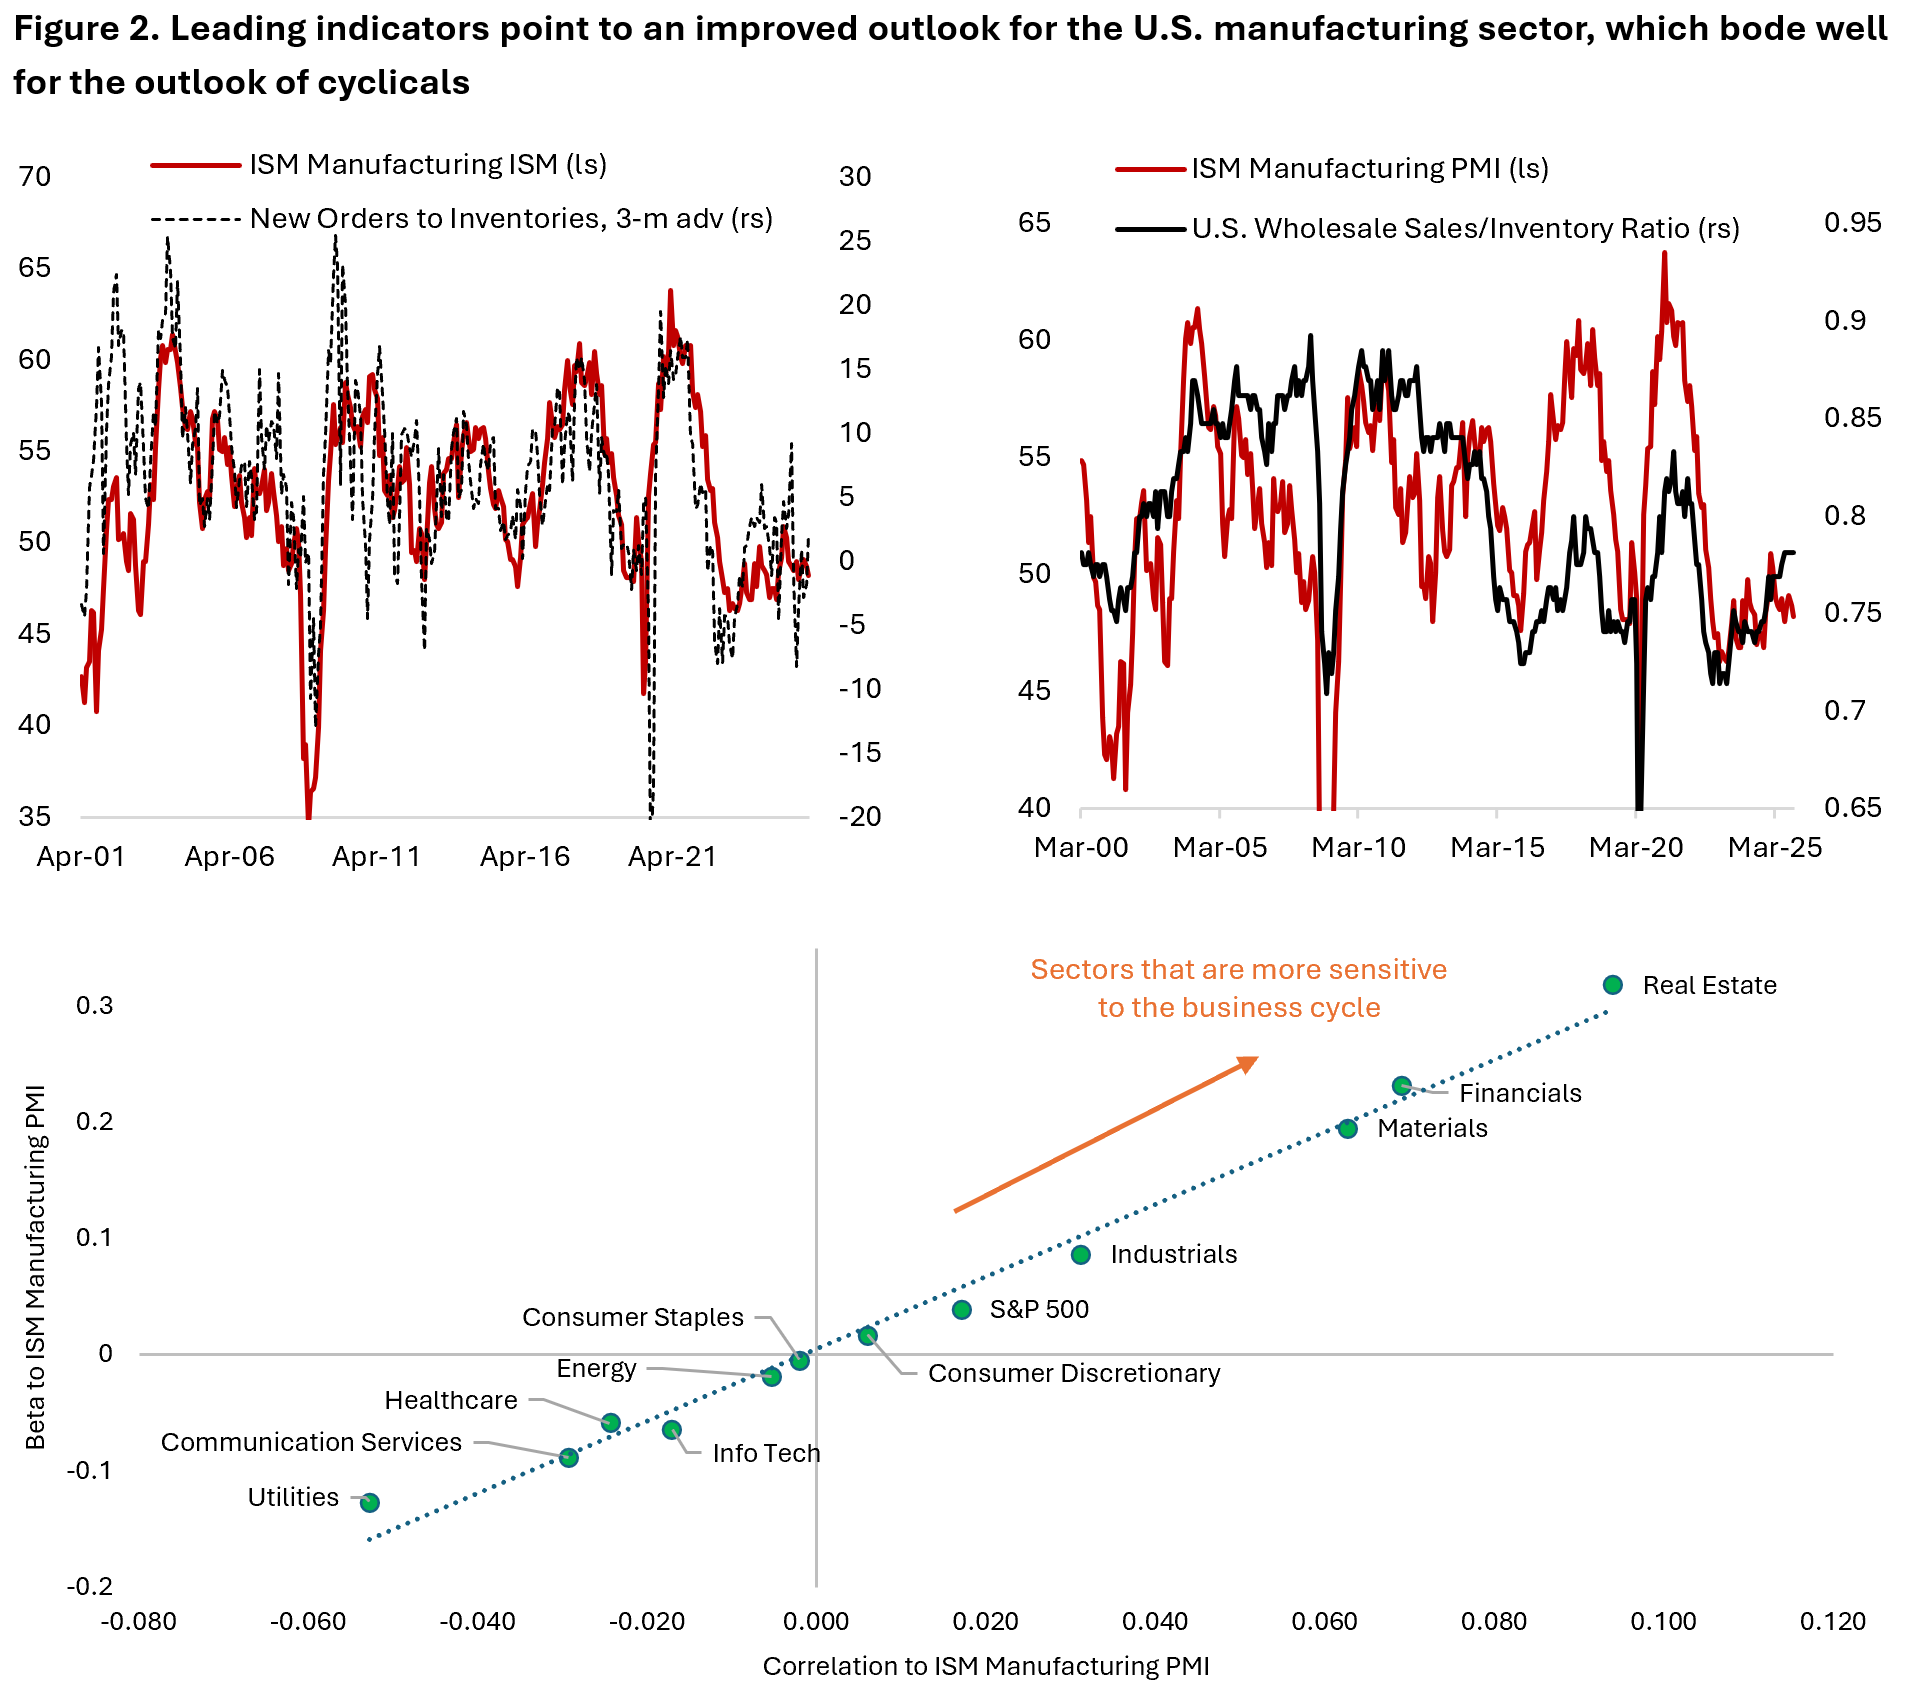
Within the industrial sector, there are evidences that the boom in AI capex spending has overshadowed the weaknesses of many other cyclical industries, whose outlook is now starting to improve. Auto, housing, manufacturing, lending by regional banks, and other select segments of industrials have all been weak in recent years, as highlighted by the ISM Manufacturing PMI hovering below 50 for most part of the past three years (Figure 2). Improving outlook for cyclical sector activity should translate to broadening of U.S. equities’ return driver and benefit the stock price of industries that have significantly lagged the broader equity benchmark since 2023.
In short, if we are correct that the U.S. business cycle is accelerating without a recession happening (i.e. labour market does not weaken materially from here), stock prices for the left-behind industries could catch up in 2026. For investors, this presents the opportunity to shift their allocation away from tech-oriented, growth stocks to beaten-down cyclicals. We remain underweight exposure to defensive sector, especially consumer staples, which should continue to lag as we expect U.S. GDP growth next year to remain close to its potential growth rate in 2026.
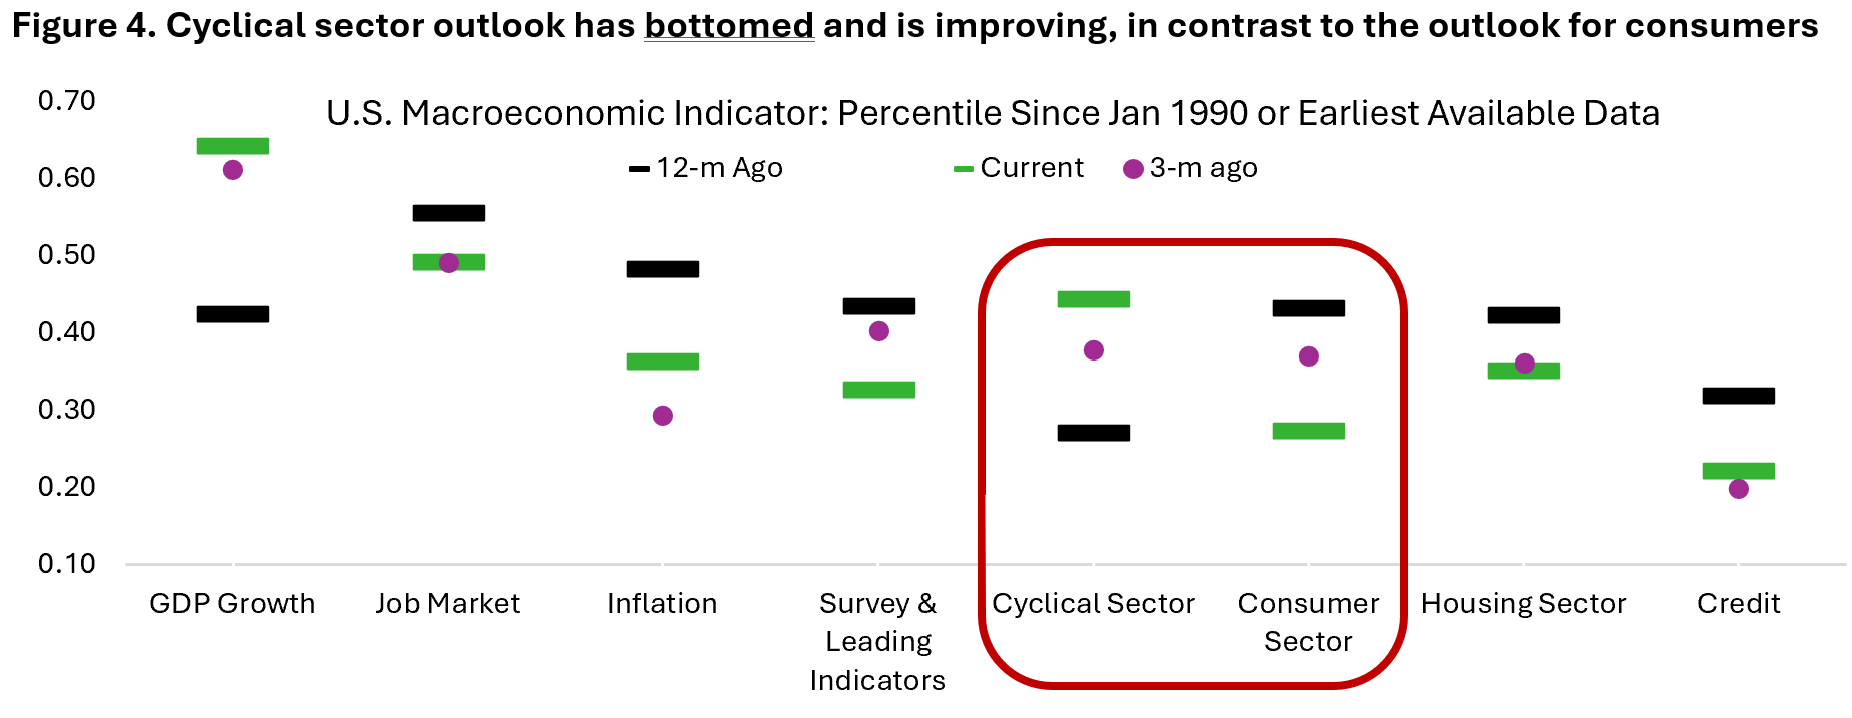
One of our main convictions in 2026 is that the outlook for U.S. consumers will remain downbeat while those of cyclical sectors should improve – essentially continuation of the trend we see over the past year (Figure 4). We expect downside risk for the U.S. economy primarily coming out of the job market and expect inflation to become less of a concern for policymakers and investors. Essentially, the path is open for a disinflationary, jobless economic boom in 2026. This potentially support the performance of long-term bonds, especially if fiscal sustainability concern is diminishing and cause the term premium to fall.
First, let’s lay out the “facts” from both the macro and micro point of view:
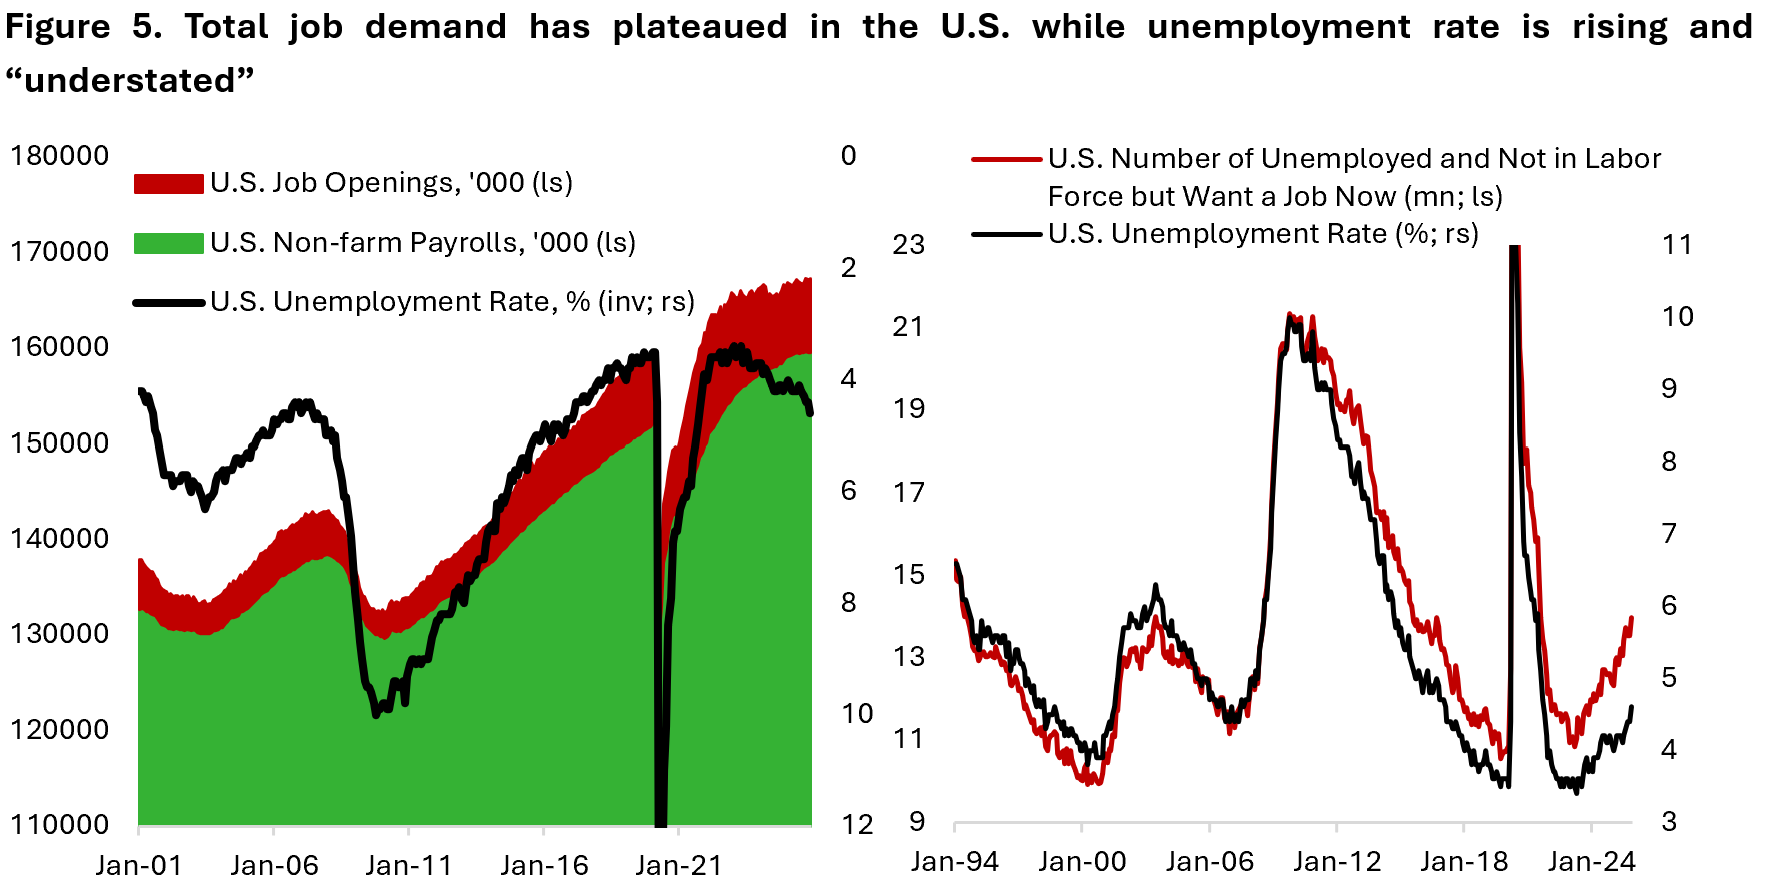
- Consumers are correctly worried about the job market. The hard data shows that total job demand has plateaued, unemployment rate is rising, and both quit rate and wage growth have declined to below trend, and workers said it is becoming increasingly difficult to get a new job. If we include people not in the labour force but want a job, unemployment rate could already be close to 6% rather than the officially reported 4.6% (Figure 5). This is in-line with the underemployment (U-6) measure rising to 8.7% in November, a cycle-high last seen in 2017.
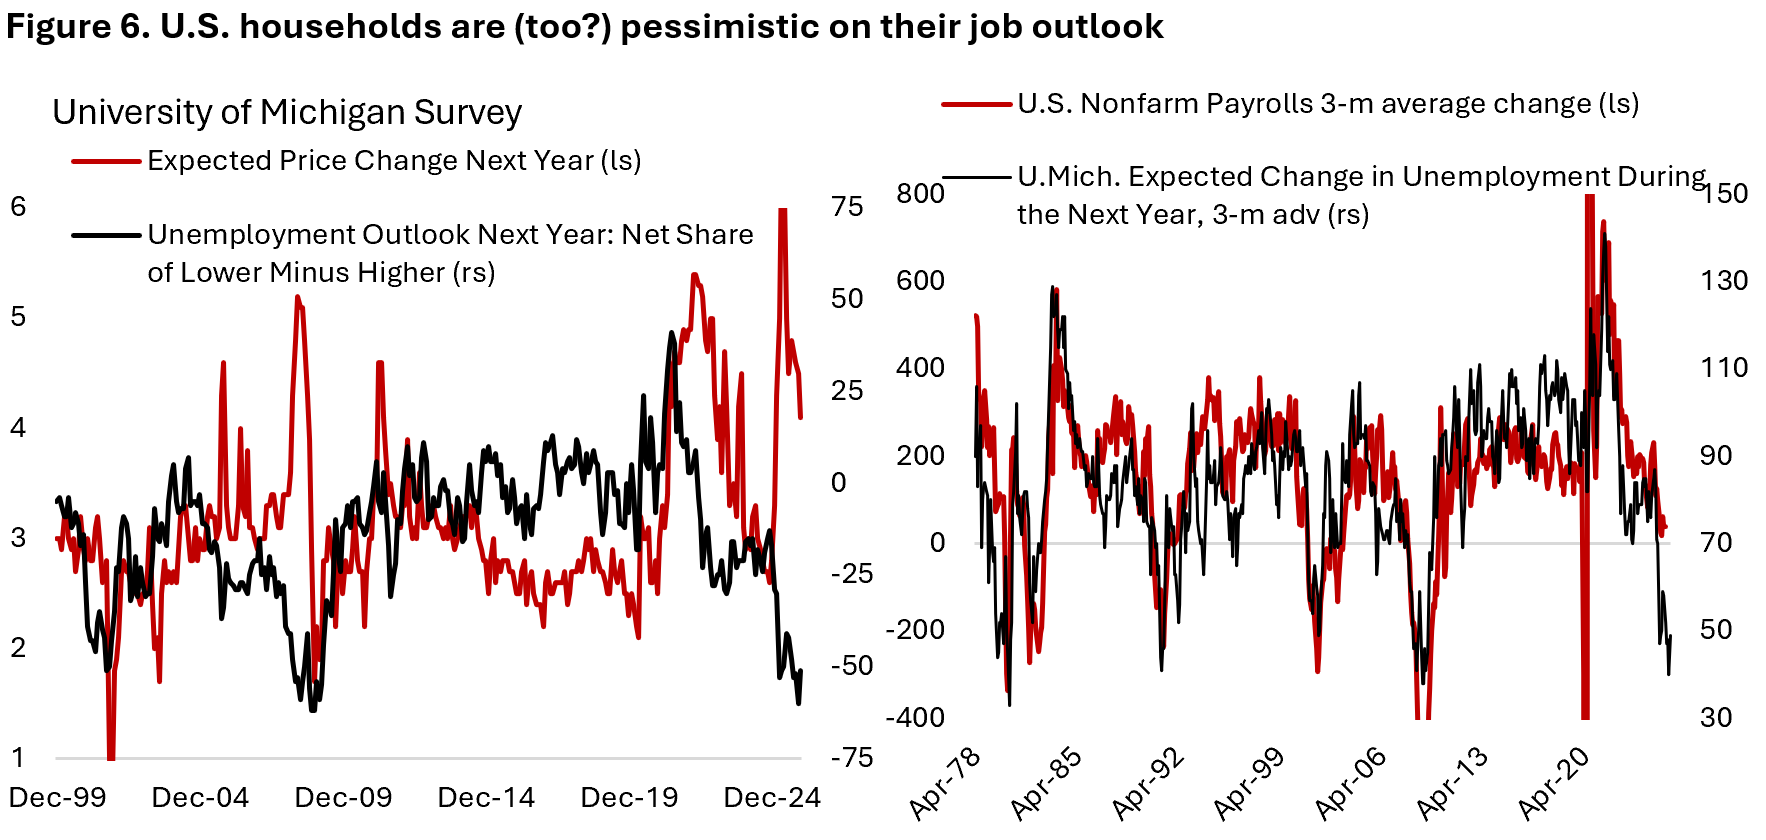
- The soft data on U.S. labour market is even worse, with households being very pessimistic on their job outlook (Figure 6). Given the highly uneven distribution of income and expenditures across income quintiles, household surveys are more pessimistic than actual income and spending growth numbers that skew towards the high-income earners. However, there are signs that the worst of the labour market deterioration is behind, taking cues from the commentaries of Robert Half (RHI) and Manpower Group (MAN), whose stock have fallen over 75% from the peak in 2021.
From Manpower Group’s Q3/25 earnings call:
“…after 11 consecutive quarters of organic constant currency revenue declines, we crossed back over to growth during the third quarter. The stabilization of demand in recent quarters in North America and Europe, despite ongoing tariff uncertainty, has been a key factor in the revenue trend improvement.”
And Robert Half’s Q3/25 earnings call:
“Client and job seeker caution continued during the quarter, subduing hiring activity and new project starts,” said M. Keith Waddell, president and chief executive officer at Robert Half. “That said, we are encouraged by the weekly trends in contract talent revenues, which sustained late second-quarter levels for most of the third quarter and began to grow sequentially in September and into October. Our fourth-quarter revenue guidance, at and above the midpoint, reflects a return to sequential growth on a same-day constant currency basis for the first time since the second quarter of 2022.
- The U.S. housing sector is weak and likely remain so in 2026, but this is likely partially priced-in the valuation and earnings estimate of homebuilders and home furnishing store such as Home Depot. Given the still-elevated house price-to-income and mortgage rate, we are less optimistic that the housing sector will stage a meaningful recovery in 2026. In addition, valuation for the subsector is just in-line with the prior 10-year average.
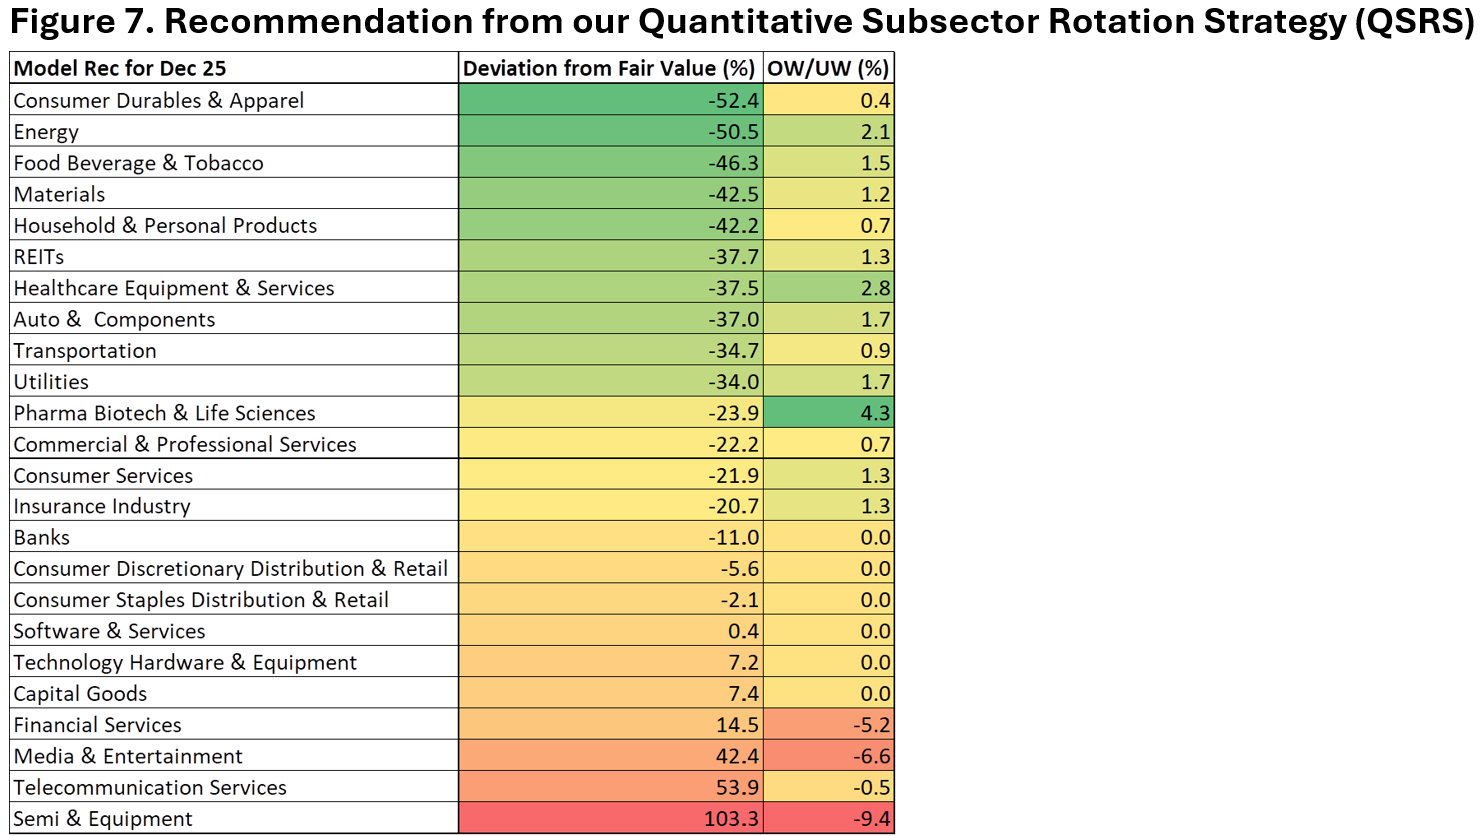
- Policy uncertainty likely has peaked, but USMCA negotiation could set for a bumpy road in the first half of the year. We believe that mid-term election in November will limit President Trump’s impulse to go aggressive in the negotiation process as affordability issues could at least be partially tied to the rising trade barriers. This could bode well for the auto industries and beaten-down transportation stocks, which ranked favourably by our proprietary Quantitative Subsector Rotation Strategy (QSRS) model (Figure 7). For instance, UPS stock price has fallen 50% from the peak amid declining revenue amid macro headwinds and deliberate pullback on less profitable segment of the business (Amazon). The stock is now trading at only 14x forward earnings, the low end of the past 10-year range and below the 17 times historical average. Over the past two years, UPS’ management has focused on what is under their control – cost – and implemented saving initiatives that will provide meaningful operating leverage once top-line growth turns positive again. In addition, the industry is a major beneficiary of AI application to sort packages and manage brokerage fees and changing customers’ tariffs charges – capabilities that both UPS and FedEx demonstrated during April’s chaotic tariffs debacle.
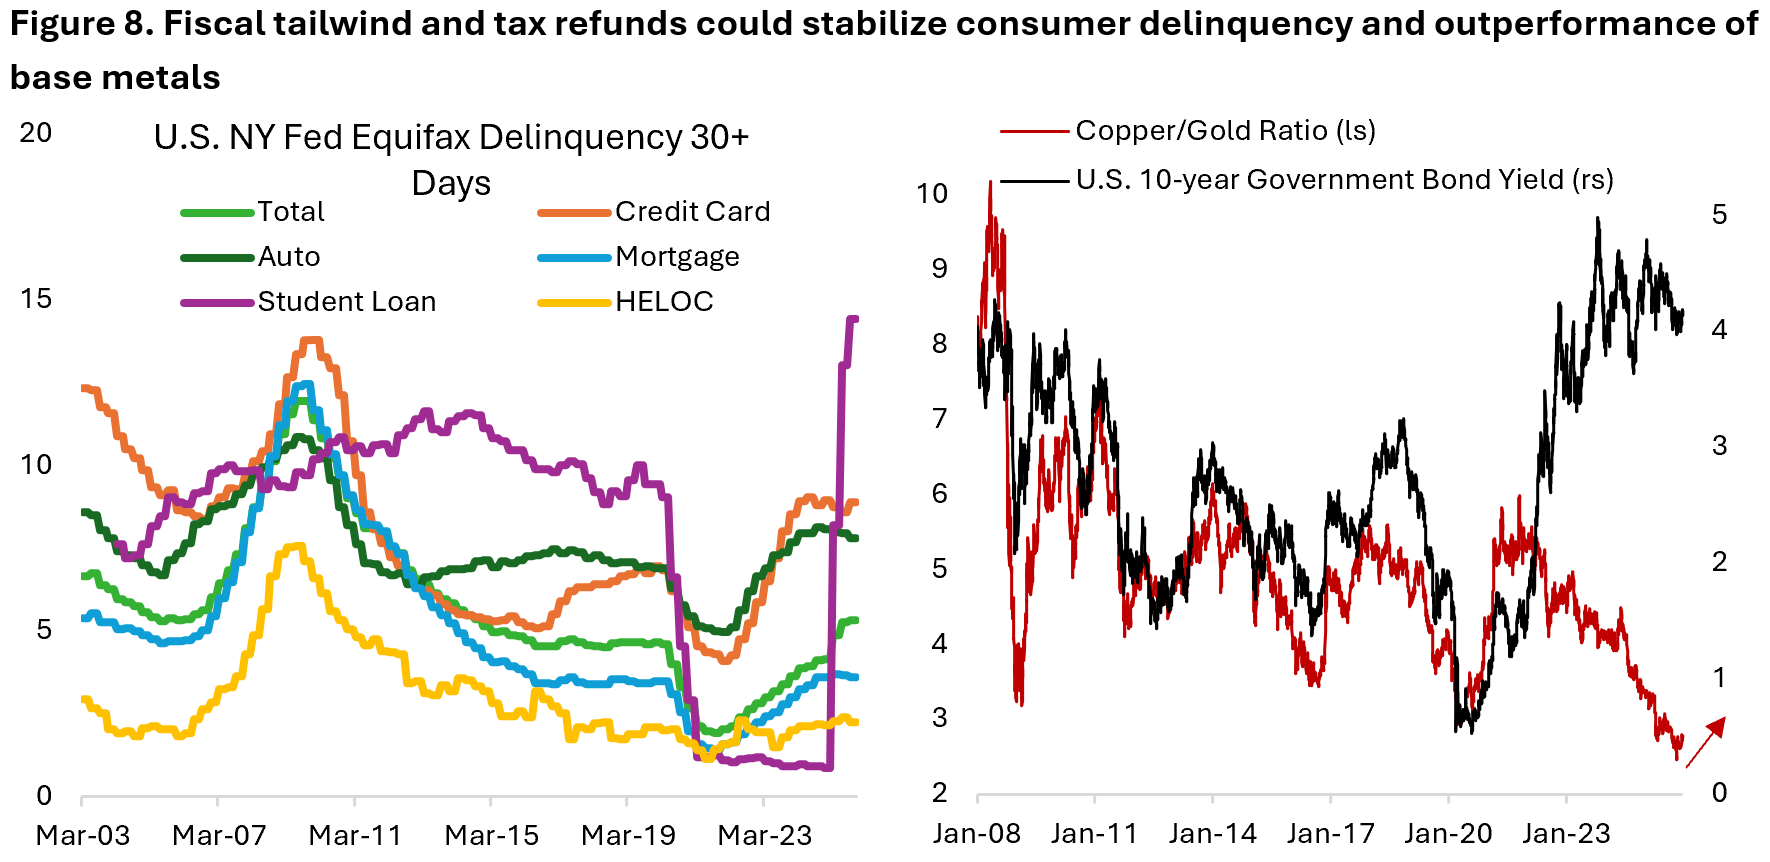
- Fiscal impulse is turning from headwind to a tailwind in 2026, estimated to boost growth between 0.5%-0.9% of GDP as OBBBA and the depreciation tax benefit should encourage business investments and reshoring. Front-loaded stimulus from retroactive personal income tax cuts means U.S. households are expected to receive roughly $80 billion in refunds in Q1 2026. This should stabilize consumer credit delinquency rates (Figure 8a) and potentially boost consumers’ spending power – improving the sentiment for retailers. For instance, Lululemon is now trading at only 16x forward earnings, half of its historical average level, on a forward earnings growth expectation of -11.8% y/y. We think this is a low bar and reflect extreme pessimism on the company’s outlook. As the outlook for U.S. and rest-of-world improve this year, our preference for commodities exposure shift from long precious metals to industrial metals (Figure 8b).
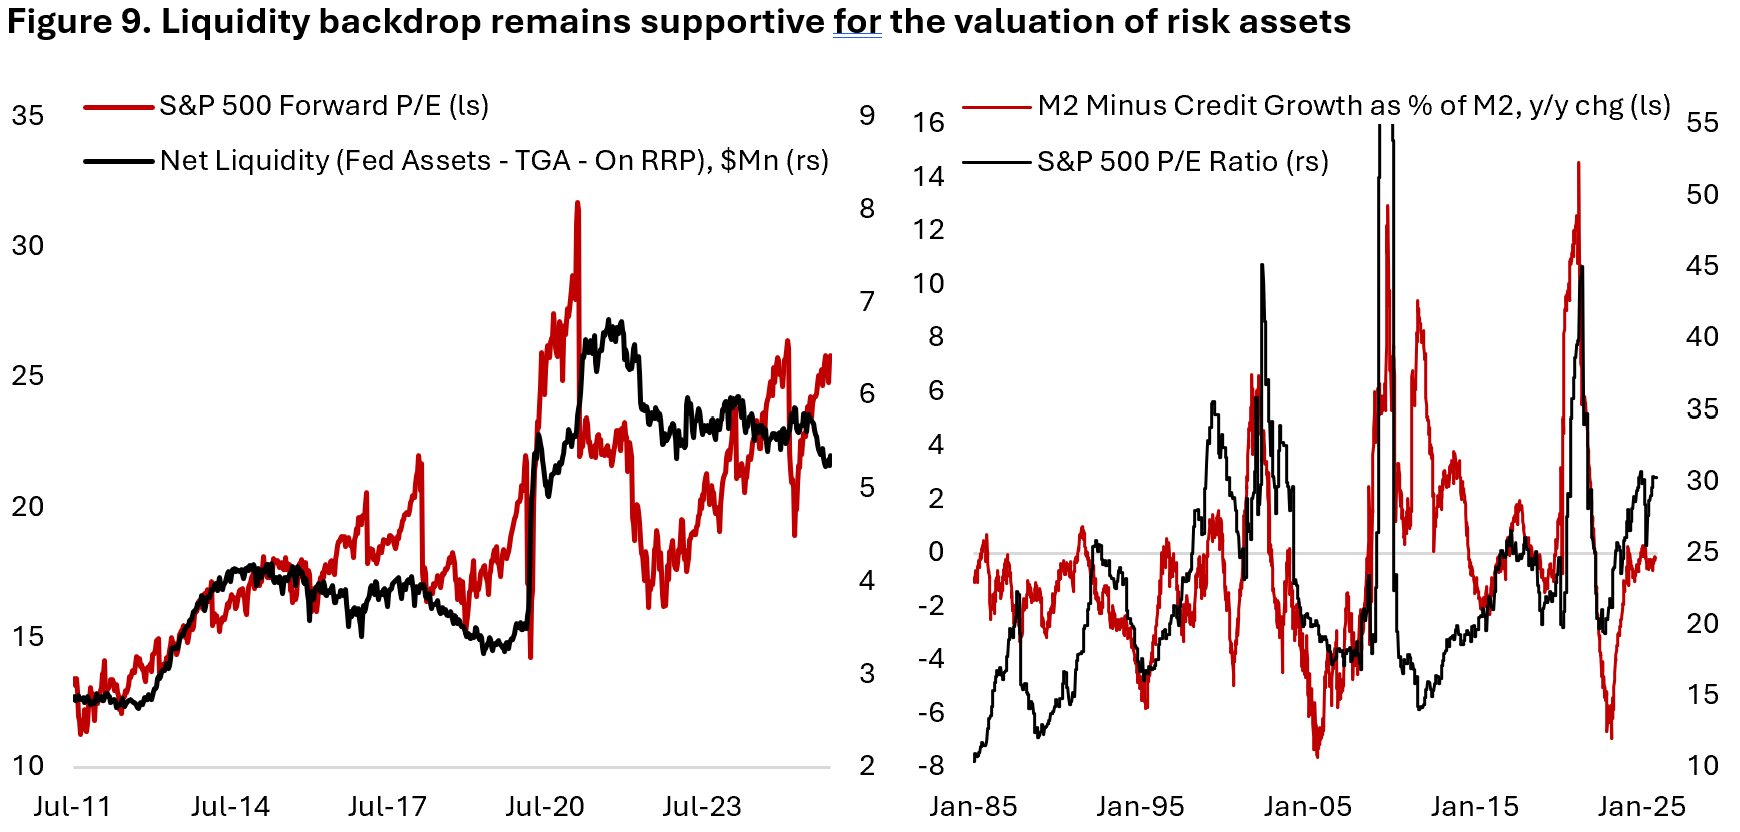
- Lagged impact of monetary easing is still in the pipeline alongside easing lending standards, which are supportive for rate-sensitive sectors. The Federal Reserve did de facto policy pivot from Quantitative Tightening (QT) to Quantitative Easing (QE) in December 2025 to maintain ample reserve balance, essentially boosting liquidity in the financial system. An improved outlook for U.S. economy and business cycle, alongside easy financial conditions, is a backdrop that historically has been supportive for equity valuation (Figure 9) and the performance of cyclicals such as transportations, materials, and U.S. regional banks. On the latter, for example, U.S. Bancorp is now trading at 11.9x forward earnings and is expected to grow earnings by 8% in the coming year, while giving dividend of 3.9% – higher than most in the sector. Even as U.S. financials have rallied in 2024 and 2025, regional banks have significantly lagged and may be due for a catch up.
The bottom line is that stabilizing U.S. labour market, declining policy uncertainty, fiscal tailwinds, continuation of easy monetary backdrop, and potential upswing in U.S. business cycle mean that the macroeconomic environment will likely remain conducive for risk assets, with left-behind cyclical subsectors potentially playing a catch up.
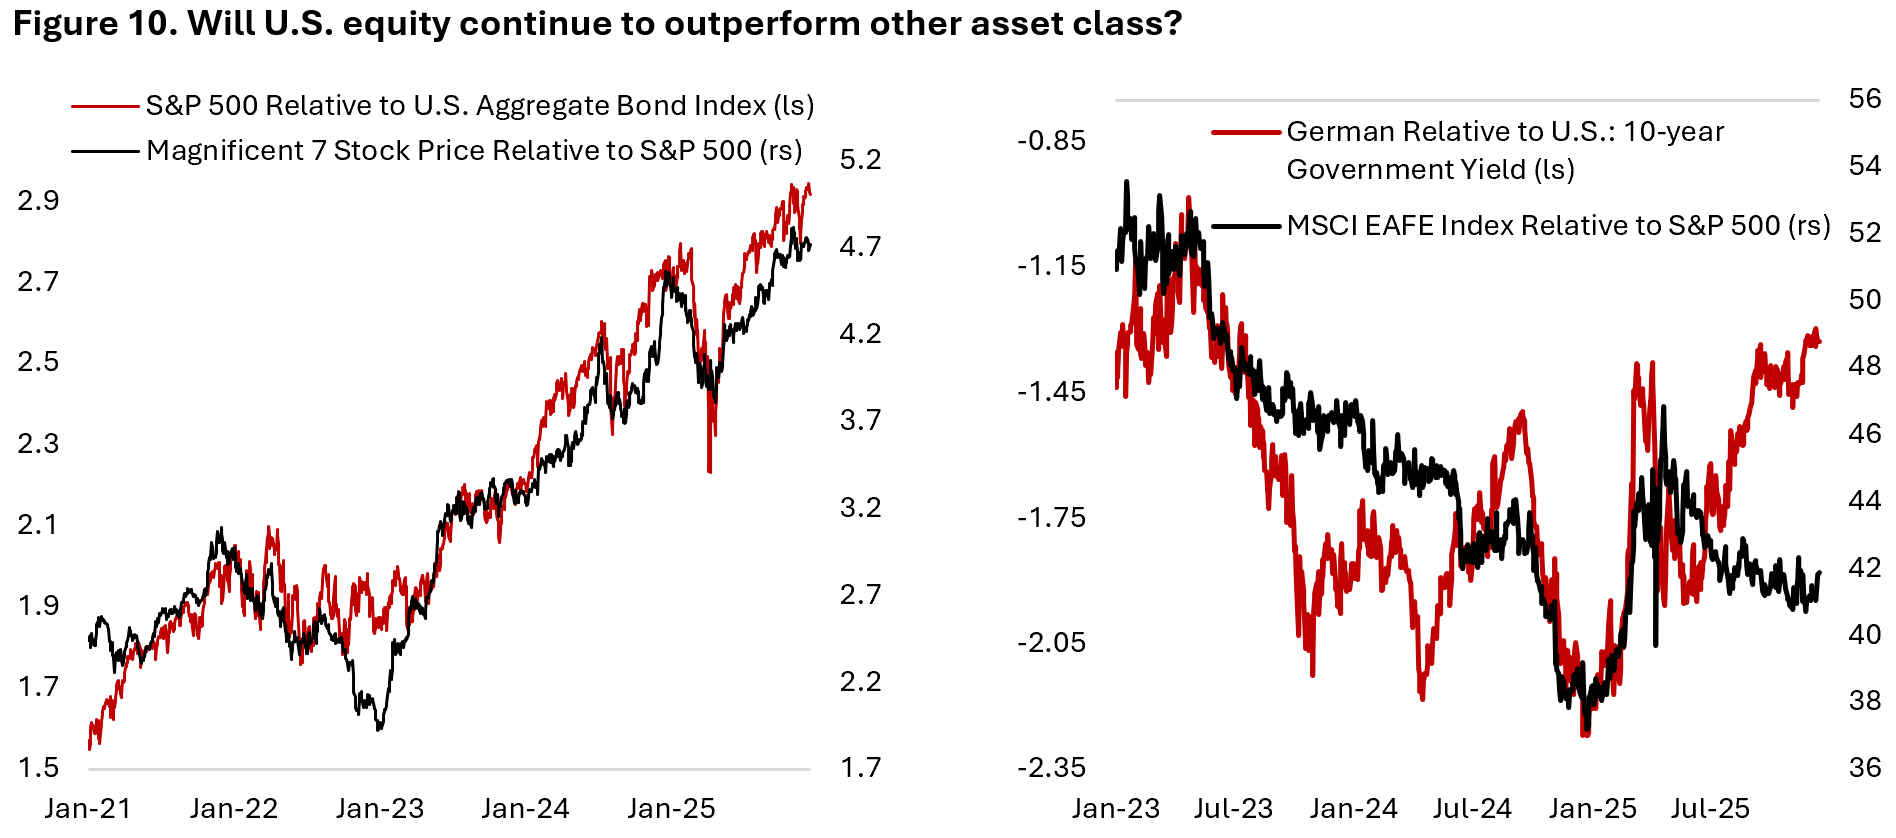
Taking a step back to asset allocation level, we believe there is high likelihood that equities will continue to outperform bonds in coming quarters, but expect the driver of equity performance to come increasingly from the laggards rather than continuation of rally among mega-cap tech stocks. In short, we think the trend that has been upheld since 2021 in Figure 10 will diverge for all the reasons we outlined in the previous section.
Within equities, we are more constructive on the outlook for international stocks vs consensus, which remain skeptical of the overall region’s prospect. ECB’s aggressive rate cut, German EUR 1Tn spending plan on infrastructure and defense, and potential cease-fire for the Russia-Ukraine conflict should all be supportive for domestic demand and drive lower energy prices. After outperforming the S&P 500, international and emerging market equities could continue to do so amid lower earnings expectation and valuation discount – although no longer as attractive as in the beginning of 2025.
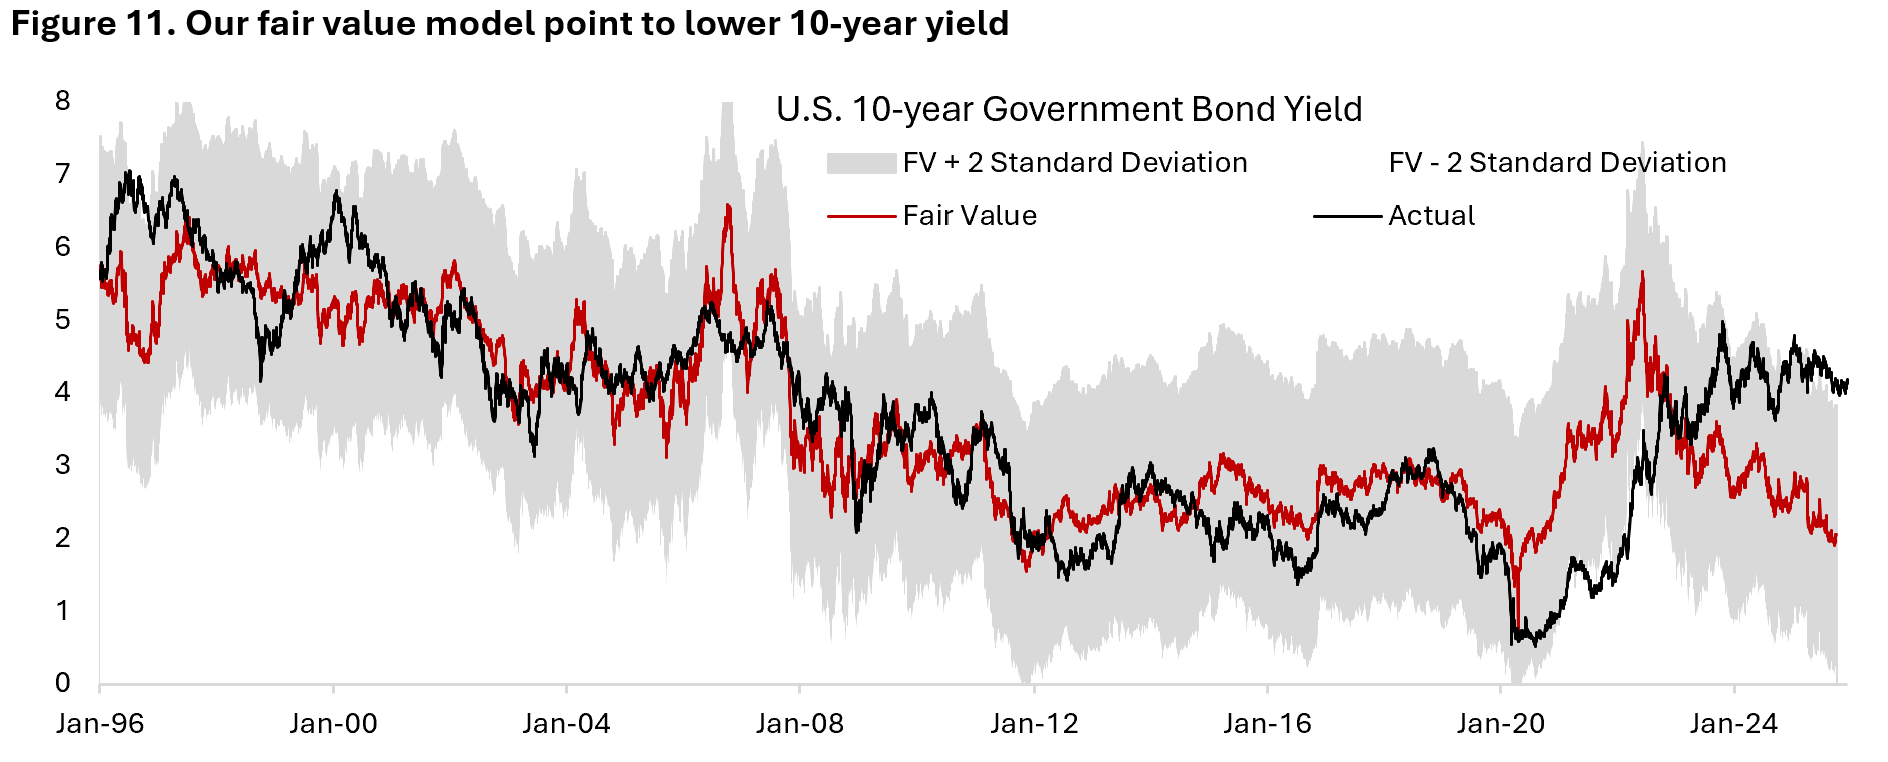
One of our most heated internal debates is on the outlook for long-term bonds. On one hand, an upswing in the U.S. business cycle and fiscal sustainability concern are two factors should push yields higher. However, we are also cognizant that term premium has increased significantly in the past three years – to above 1% currently – and these factors may already be reflected in the current yield level. Our fair value model for U.S. 10-year yield, which indicates yield undershot significantly between 2020 and 2022, now think it has overshot materially (Figure 11). With inflation making decent progress over the past three years and the risk to the U.S. labour market tilted to the downside, the risk/reward for bonds is improving compared to in 2021-2023 period.
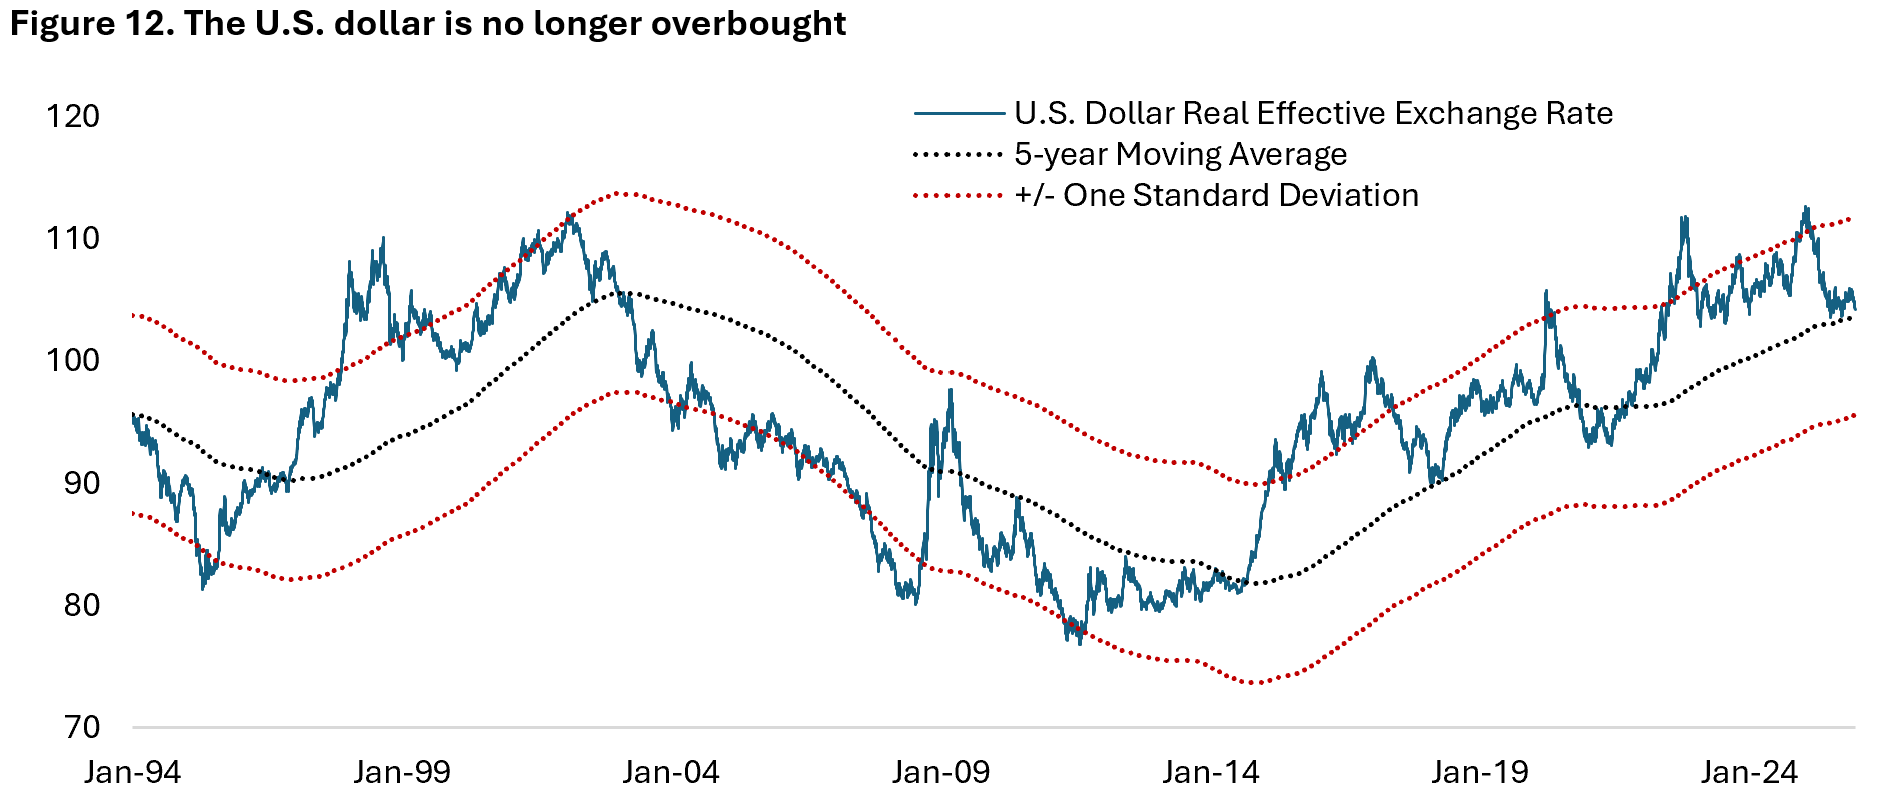
Lastly, on the U.S. dollar. For the last few months, we have become less bearish on the outlook for the greenback as it has fallen quite a bit on a real effective basis and is now close to prior 5-year moving average (Figure 12). If we are correct that European business cycle is also inflecting higher and that the continent’s growth outlook will also improve in 2026, the U.S. dollar could resume its slide but likely in a more gradual pace relative to the rapid depreciation we saw in 2025. Note that the ECB is likely already at the end of its monetary easing cycle, whereas the Federal Reserve is still expected to cut several more times this year.
To recap, we continue to advocate investors to shift allocation from growth-oriented tech stocks into cyclicals that have lagged in the past three years as upswing in the U.S. (and rest of world) business cycle should translate to these subsectors to recover from depressed sentiment and valuation. Given the higher cyclical sector exposure of international and emerging market stocks, it is perhaps unsurprising that we also think the regions could continue its outperformance in 2026, after doing so in 2025.
Copyright © 2025, Putamen Capital. All rights reserved.
The information, recommendations, analysis and research materials presented in this document are provided for information purposes only and should not be considered or used as an offer or solicitation to sell or buy financial securities or other financial instruments or products, nor to constitute any advice or recommendation with respect to such securities, financial instruments or products. The text, images and other materials contained or displayed on any Putamen Capital products, services, reports, emails or website are proprietary to Putamen Capital and should not be circulated without the expressed authorization of Putamen Capital. Any use of graphs, text or other material from this report by the recipient must acknowledge Putamen Capital as the source and requires advance authorization. Putamen Capital relies on a variety of data providers for economic and financial market information. The data used in this publication may have been obtained from a variety of sources including Bloomberg, Macrobond, CEIC, Choice, MSCI, BofA Merrill Lynch and JP Morgan. The data used, or referred to, in this report are judged to be reliable, but Putamen Capital cannot be held responsible for the accuracy of data used herein.
