It’s summertime and volatility in the financial market has been relatively muted compared to what we saw earlier this year. Indeed, summertime has historically been a period of relative quiet in the market before volatility started to pick up in September and October (Chart 1). For macro strategists, this is the perfect time to reflect on the big issues afflicting financial markets and review their asset allocation.
In this month’s publication, we aim to address investors’ questions ranging from the damage from tariffs, recent weak labour market data, to the opportunities arising amid resumption of policy easing cycle.

- Are we heading for a stagflation?
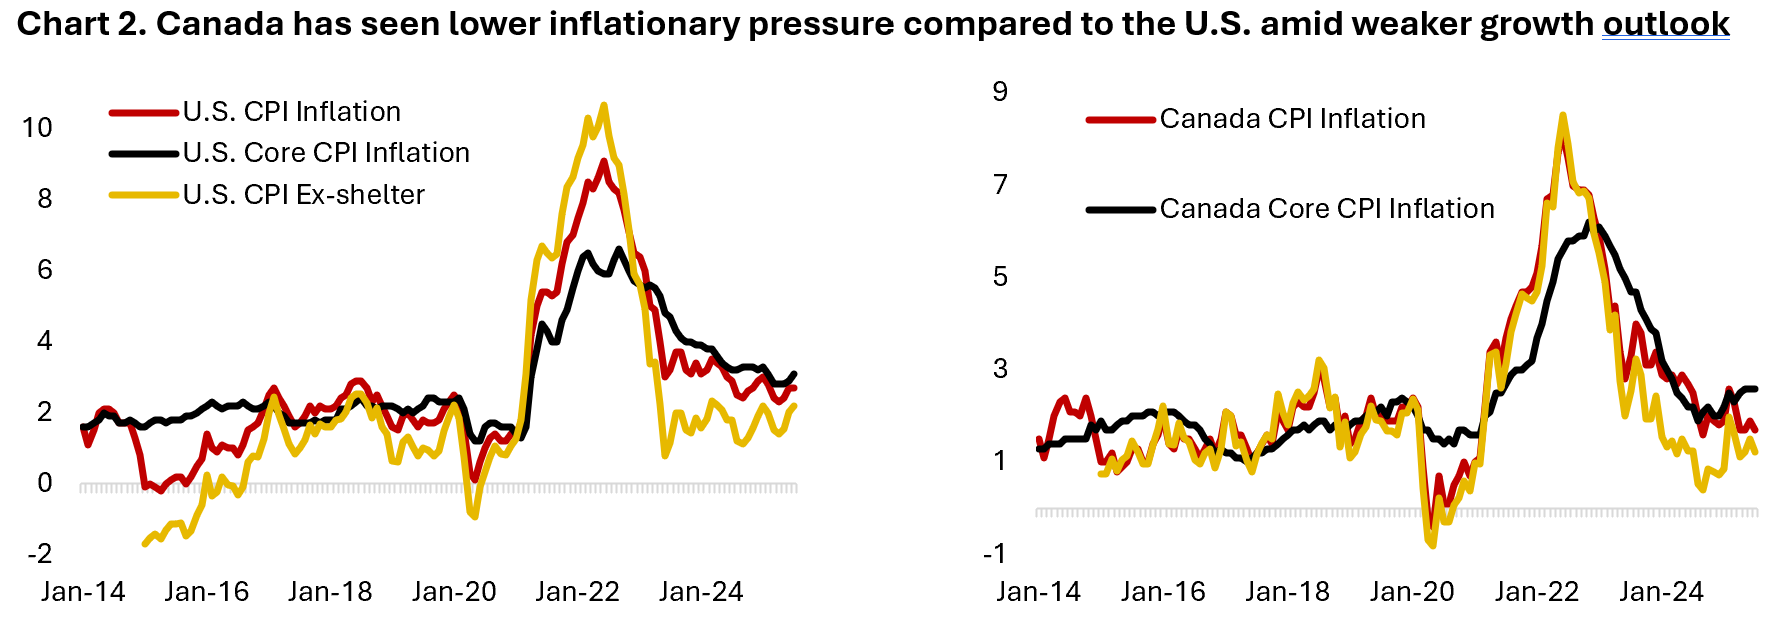
We have long held the view that tariffs are a one-time price jump rather than a continued inflationary pressure, meaning that although it will hit both consumers through higher prices and companies’ margin from higher input cost, it should not translate to a multi-year price pressure. In fact, the impact of U.S. tariffs could be deflationary for Canadian economy given goods exports to the U.S. will likely see slower demand – a headwind for both Canadian labour market and economic growth. On this front, there is less worry on Canadian inflation outlook compared to those for the U.S. (Chart 2). Canadian headline, core and ex-shelter inflation is currently at 1.7% y/y, 2.6% y/y, and 1.2% y/y, respectively in July – much softer than the U.S. figure at 2.7% y/y, 3.1% y/y, and 2.2% y/y.
We do, however, expect goods inflation to move higher in the coming months as companies adjust their pricing to partially or fully pass the higher input cost to consumers. For instance, when the U.S. imposed tariffs on washing machine imports in January 2018, the impact could only be seen in the CPI figure three to six months afterwards (April, May, and June). Given that the escalation on U.S. tariffs this year started in April, we expect goods inflation to rise in the second half of 2025 – some of which could already be seen in July’s CPI numbers, including categories such as household furnishing and supplies, tools, and select electronic equipment.
On the positive note, we expect U.S. service inflation to continue to move lower amid softer labour market trend and falling rental prices, which support the view that headline and core inflation should not see an acceleration. In short, the macro dynamic today is very different compared to following the pandemic when both prices and wages were moving sharply higher. As the labour market weakens, Chart 3 shows that the premium for moving jobs has largely diminished. Meanwhile, shelter inflation, which accounts for 36% and 29% of the U.S. and Canadian CPI basket, respectively, should continue to fall as actual rental price inflation is turning into a deflation (Chart 4). The bottom line is that there is little sign that inflation will accelerate sharply from current levels.

- Where are the damages from U.S. tariffs? Should investors worry about fiscal profligacy?
The second quarter earnings highlight U.S. companies’ resiliency in face of tariffs uncertainty and slower consumer spending. Due to the front running of imports following U.S. tariffs announcement, the built in inventories have cushioned the short-term damage of higher imported goods prices, with margin staying largely intact for the quarter. The gap between CPI and PPI inflation – a proxy of output and input prices for corporates – indicates profit margin unlikely to further expand in the coming year, contrary to current consensus expectation (Chart 5).
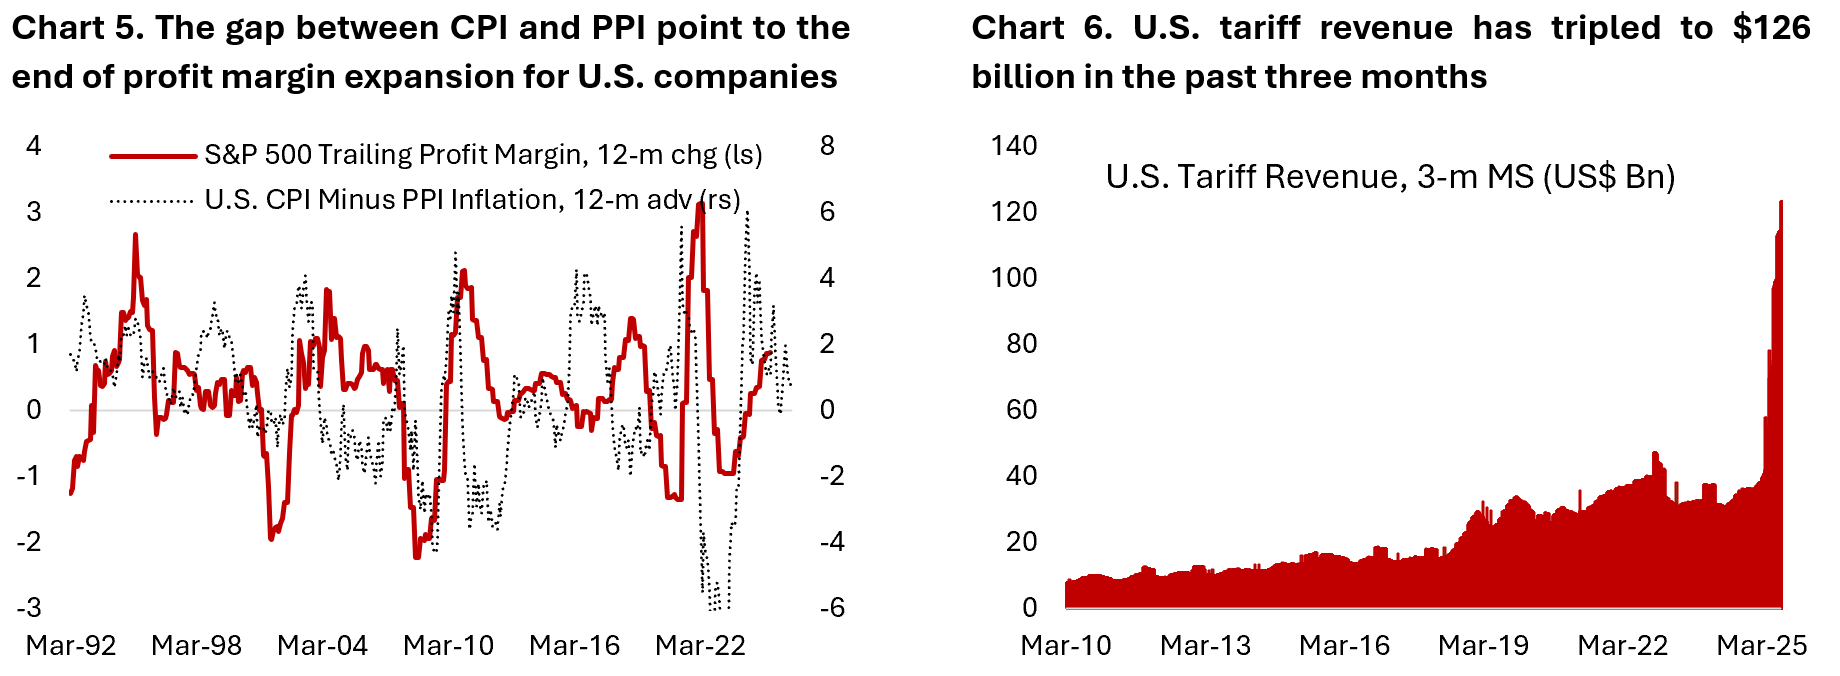
The deteriorating corporate margin outlook is mirrored by the surge in tariffs revenue collected by the U.S. government, which sums $126 billion in the past three months alone – essentially a tax on American companies and consumers (Chart 6). Will tariff revenue pay for the tax cuts announced in the One Big Beautiful Bill Act (OBBBA)? The bond market does not think it will, as reflected by the bull steepening of the yield curve (yields at the long end of the curve moving higher while short-term yield fell). In sum, the expectation of policy rate cut has so far failed to bring yields at the long end of the curve lower as investors demand higher risk premium for investing in longer-term maturities. Indeed, fiscal outlook for the U.S., France, and Japan is worrisome (Chart 7 and 8).

- Where are we in the cycle? Are we going to see another policy rate cut cycle in the U.S. and Canada?
Over the past six months we have seen an upswing in the European business cycle amid the more aggressive rate cut by ECB last year. Japanese economy has stayed strong amid tight labour market and the Bank of Japan is still on a monetary policy tightening bias – contrary to the rest of the world. Meanwhile, U.S. and Canada have yet to see a clear upswing on the business cycle with both economies running slightly below trend growth (Chart 9). This is highlighted by the recent release of Q2/25 GDP. Stripping out the volatile components (net exports and inventory built) in headline GDP growth numbers, domestic demand growth for the U.S. and Canadian economy is running at around 1.1%-1.6%.

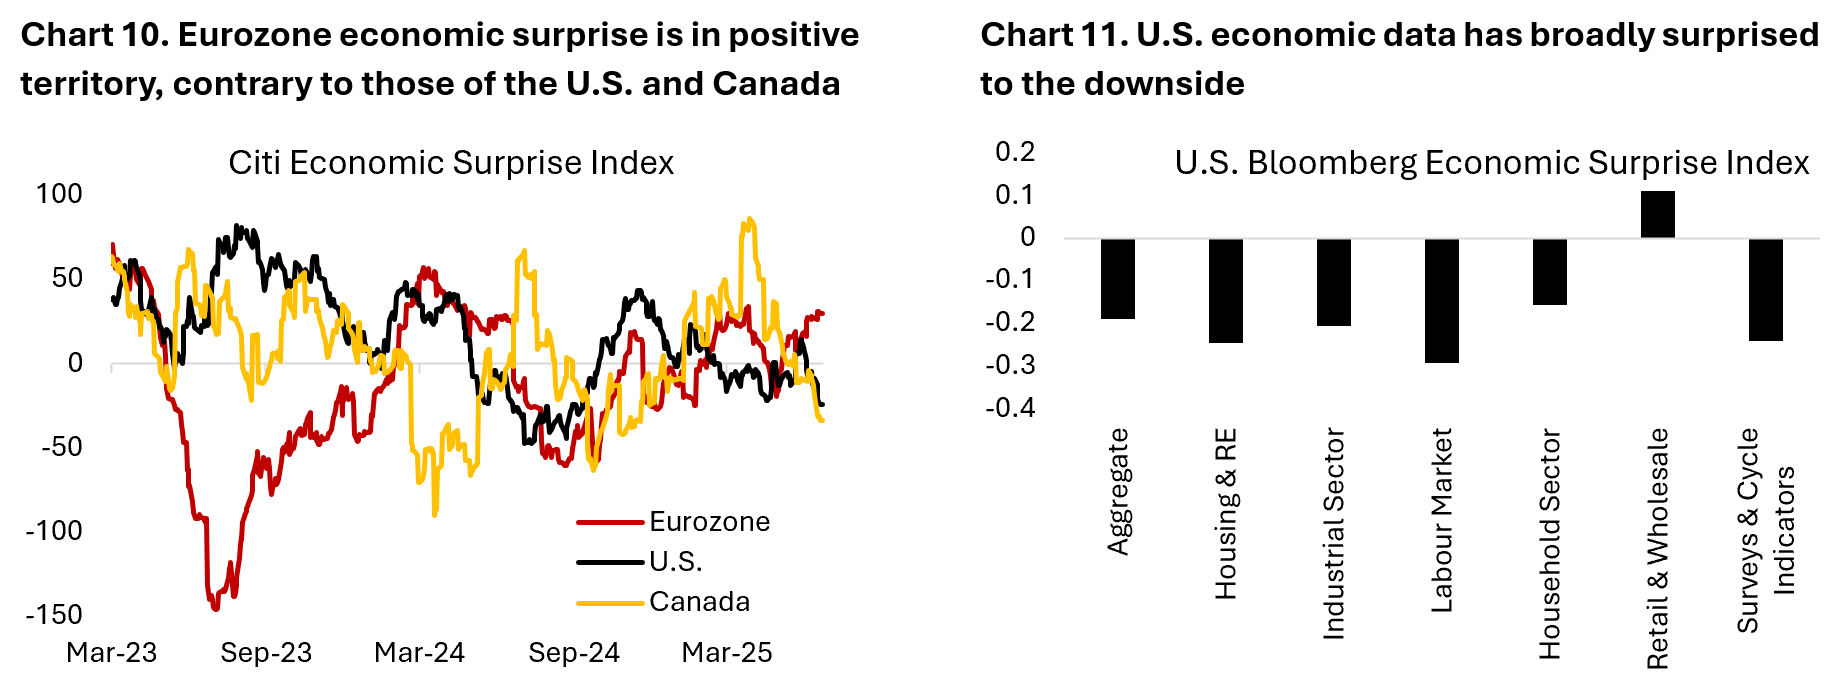
Fed Chairman Powell at the Jackson Hole conference highlighted the downside risk from looser labour market and said that such condition warrants an adjustment in policy rate. In addition, economic data in the U.S. and Canada has been surprising to the downside of late (Chart 10 and 11). In the U.S., bond traders are now pricing in at least four 25 bps rate cut until mid-2026 when policy rate is expected to settle around 3.25%. Whereas in Canada, we have seen more aggressive rate cut cycle last year and the market is now expecting only one more 25 bps cut until mid-2026 with policy rate ending around 2.5%. The lower terminal rate for Canadian rate will likely stay given much weaker productivity growth of Canadian labour market and more cyclical domestic economy.
- Will the housing market and other cyclical sectors recover then?
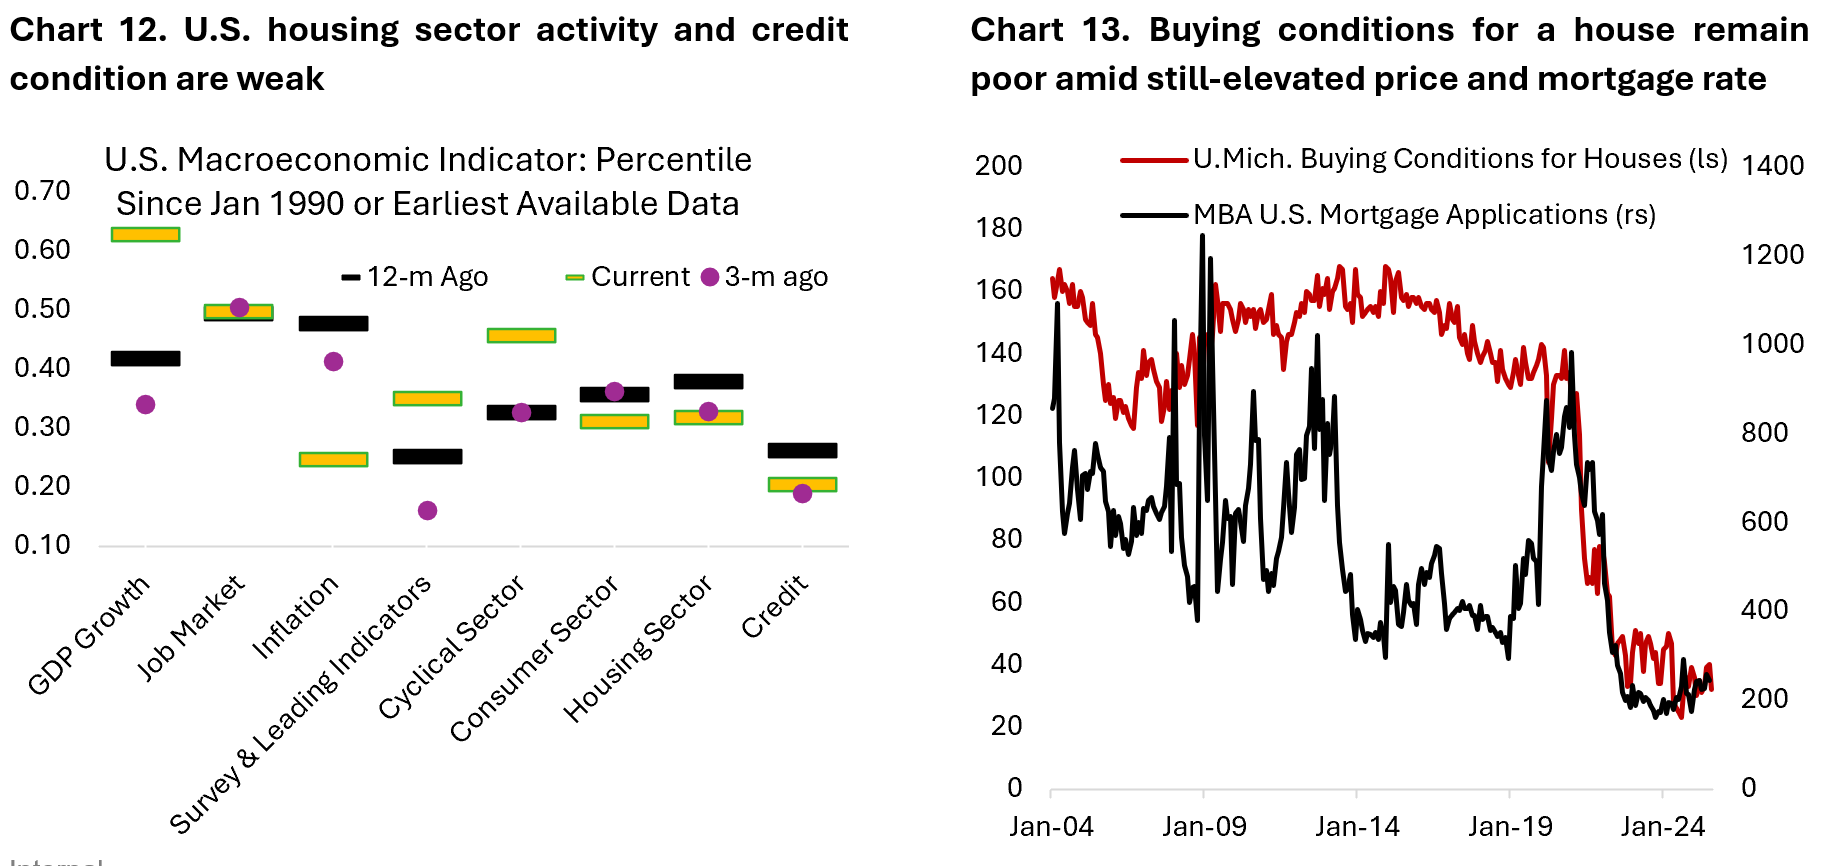
Housing has been one of the weakest sector in the U.S. economy since 2022 (Chart 12). Buying conditions for house remain poor as mortgage rate today is still above 6.5% and house price is only slightly below its peak in 2022. It’s unsurprising that mortgage applications are half of the average prior to the pandemic (Chart 13), although we think this should trend higher as policy rate – and by extension mortgage rate – decline amid the prospect of Fed’s resumption in easing monetary policy.
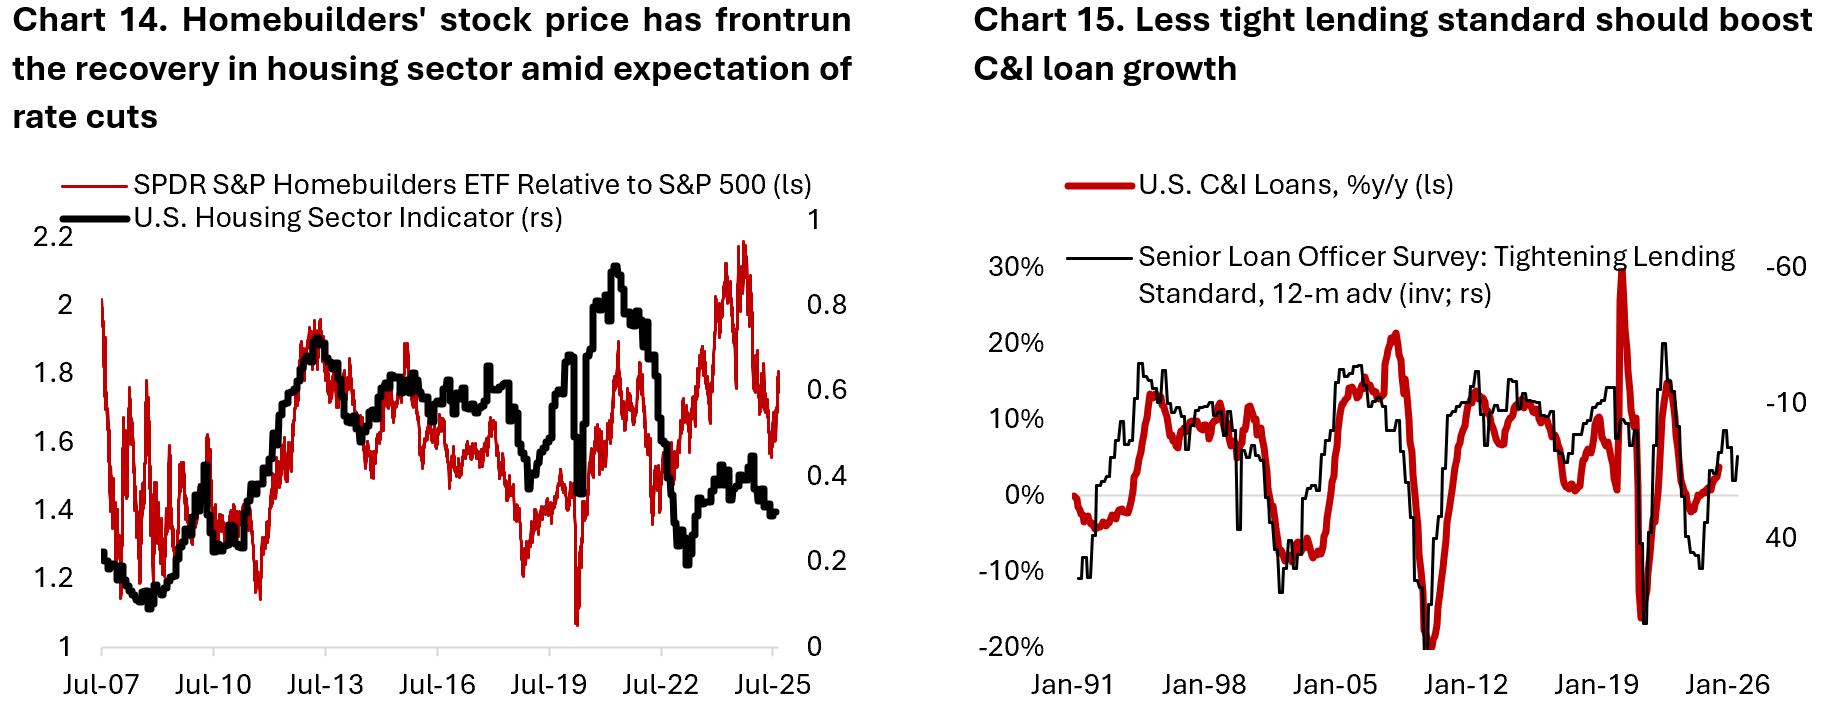
The improving sentiment in the housing market could be seen in the recent outperformance of homebuilders’ stock price, which historically coincided with period of recovery in the housing sector (Chart 14). Manufacturing activity and credit growth will likely also see a tailwind from the cyclical recovery in U.S. business cycle, especially now that lending standards are easing (Chart 15).
- How healthy is the U.S. consumers?
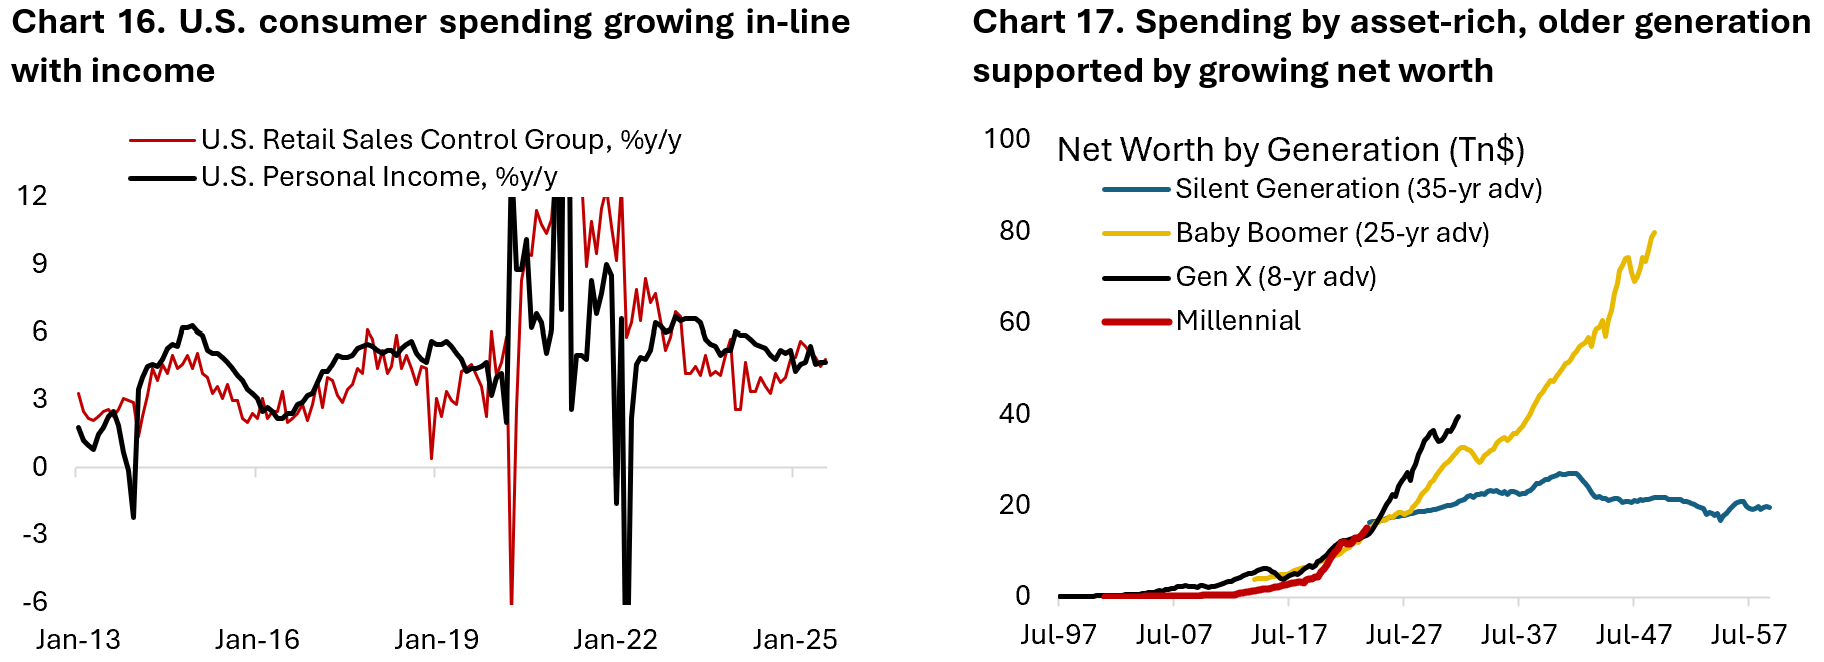
On a headline basis, U.S. consumer spending is growing at around trend rate and supported by the healthy rise in personal income (Chart 16). Underneath the hood, however, there is sharp divergence in U.S. consumer spending over the past three years between the older, asset-rich cohort and the asset-poor, younger generation that has seen a more pronounced pullback in spending and deterioration in credit quality. Rising equity and housing value have bolstered the purchasing power of baby boomers (Chart 17), with cruise lines reporting a very strong booking even as other discretionary spending such as luxury goods seeing a slowdown.
A Federal Reserve working paper, “Lost in Aggregation: Geographic Mismeasurement of Income and Spending,” highlights that the aggregate consumer spending data buries a crucial trend: much of the so-called resilience of the American consumer over the past few years has been propped up by those at the top, while the majority of households have been quietly tightening their belts. If you just looked at the aggregated income data, you would think that all Americans kept spending after the pandemic and utilize their credit card in a post-lockdown spending spree. But the granular data shows that the engine of that spending boom was mostly rich, while everyone else has been just trying to keep up or worse, under the water.
The younger cohorts, meanwhile, have contributed disproportionately to the rise in credit delinquencies across various categories (Chart 18). The resumption of student loan payment translated to a 13% default rate across borrowers – the highest since the series began – while credit card and auto delinquency have also risen few percentage points above pre-pandemic levels. Whether the headline consumer spending number will further soften or stabilize at the current trend growth hinged on the outlook for U.S. labour market, which has been holding on remarkably resilient compared to in prior cycles (Chart 19).

- Are we entering a labour market cycle in the U.S. and Canada?
The outlook for U.S. and Canadian labour market is deteriorating but job market conditions are broadly stable as layoff remains low for now. We believe that in the U.S., jobs creation has slowed to a point that further softening would not be welcome by policymakers and the financial market. Chart 20 highlights households’ pessimism on the outlook for employment in the coming year has reached a level that historically marked a period of contraction in employment, which makes the recent poor non-farm payroll numbers worrisome.

Whereas in June the non-farm payroll gains were estimated to still average 135k on a 3-month rolling basis, this number dropped to 35k in July. First, the payroll figures for the month of May and June were altogether revised lower 258k. Second, the U.S. economy is estimated to add “only” 73k jobs in July – a much slower pace compared to in the last six months – all attributed to the jobs addition in healthcare and social assistance industry. The breadth of job gains has deteriorated further with only 47% of industries reporting net job gains, far below the normal range of 60% to 80%. Over the past three months, all jobs added in the economy is concentrated in government, education, and health services – sectors that are less sensitive to the business cycle.
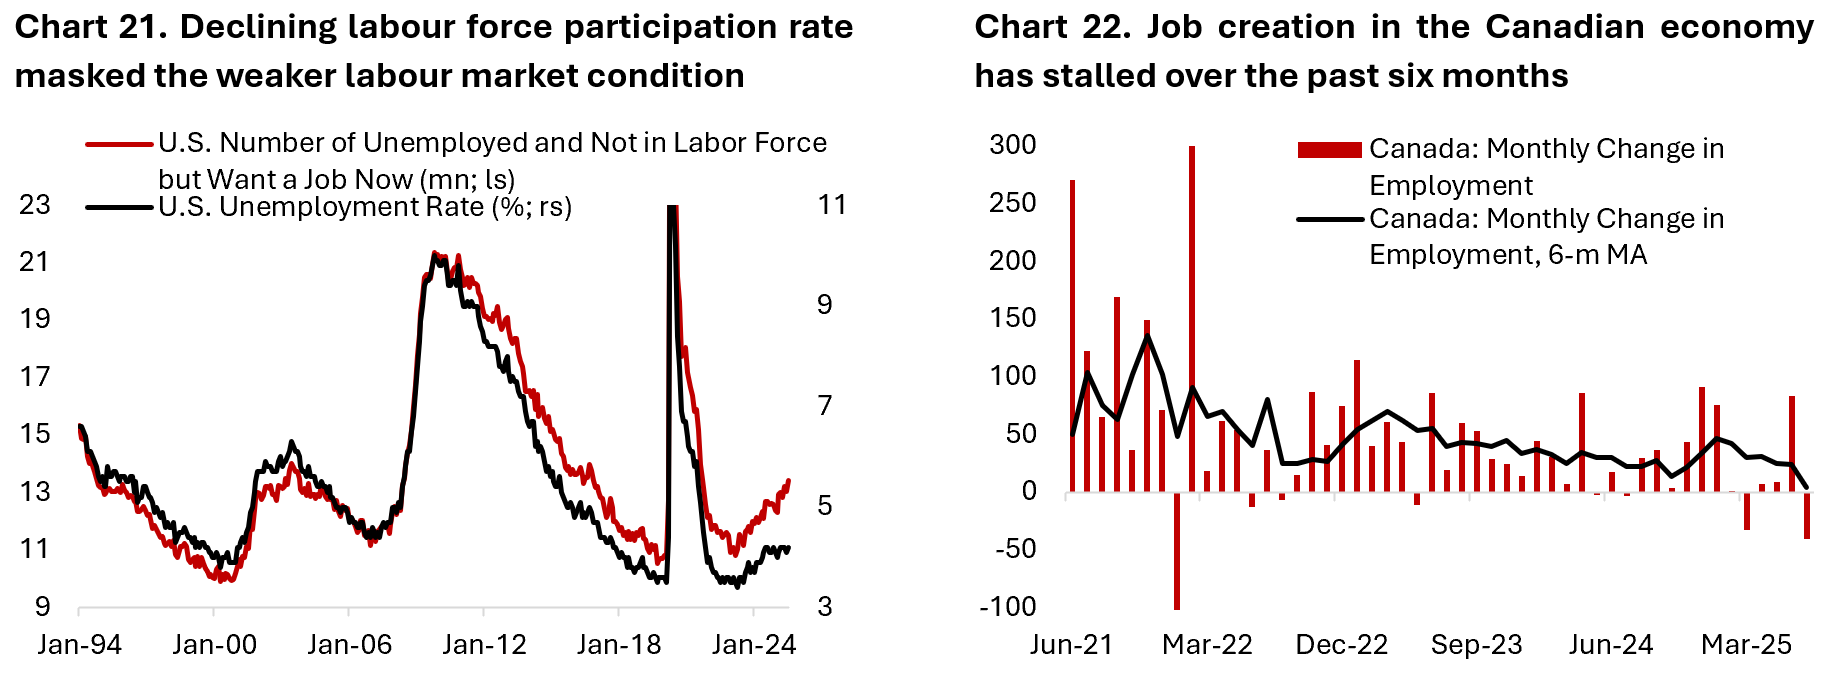
We are potentially on a pivotal point for the U.S. labour market. Following a freeze in hiring, historically it does not take long for unemployment to start ticking higher, which is indeed happening but does not show up in the unemployment rate figure amid lower trend in labour force participation rate. Chart 21 shows the divergence between the official unemployment rate, which has been stable around 4%, and the number of people categorized as unemployed (7.24 million) plus those not in the labour force but want a job now (6.18 million). The later has been rising to 13.4 million in July from 10.8 million in March 2023 and is perhaps more representative of the slack in U.S. labour market.
Meanwhile in Canada, the economy has barely added any jobs over the past six months up to July as trade uncertainty and weaker underlying growth puts hiring across sectors on a freeze (Chart 22). Unemployed people continued to face difficulties finding work in July, with 23.8% of the 1.6 million people who were unemployed classified as long-term unemployment (meaning they had been continuously searching for work for 27 weeks or more). This was the highest share of long-term unemployment since February 1998 outside the pandemic. Meanwhile, youth unemployment rate at 14.6% is also at the highest rate since September 2010. Clearly, Canadian labour market is at a much softer place the risk of contraction is higher given trade uncertainty and relatively weak domestic demand.
- What is driving the weak trend in Canadian GDP growth?
The second quarter Canadian GDP growth shows the impact of trade uncertainty amid U.S. tariffs, with the economy contracting 0.4% q/q following a 0.5% expansion in Q1/25. Much of the drag on growth could be attributed to the decline in exports (-7.5% q/q; auto exports fell 25% q/q and industrial machinery -18.5% q/q) and falling business investment. For context, in Q1 Canadian GDP benefitted from the pull-forward in exports demand, hence the reversal of net exports and inventory built in Q2 could be seen as normalization rather than outright weakness (Chart 23).

On the more positive note, final domestic demand grew 0.9% q/q in Q2 – accelerating from the 0.2% contraction in Q1 – meaning that the underlying growth picture is not as bad as the headline suggest, despite being on the softer side. Given that Canadian economy has barely added any jobs in the six months up to July and wage growth is slowing, we are doubtful this trend will continue in the second half of the year.
Note that on per capita basis, Canadian real retail spending has not grown since 2018 (Chart 24). Unlike in the U.S. where consumers have de-levered since the global financial crisis, Canadian households’ balance sheet are much more levered. Canadian household debt to disposable income is at 174% compared to only 92% for the U.S., which translate to around 15% of Canadian household income allocated to servicing debt vs only 8.1% for the average U.S. household – limiting household capacity to spend without going into debt or dipping into savings. Larger fiscal and monetary stimulus is likely needed to help boost growth for the Canadian economy.

- The U.S. equity market is near all-time high, should investors be concerned? Where are the opportunities?
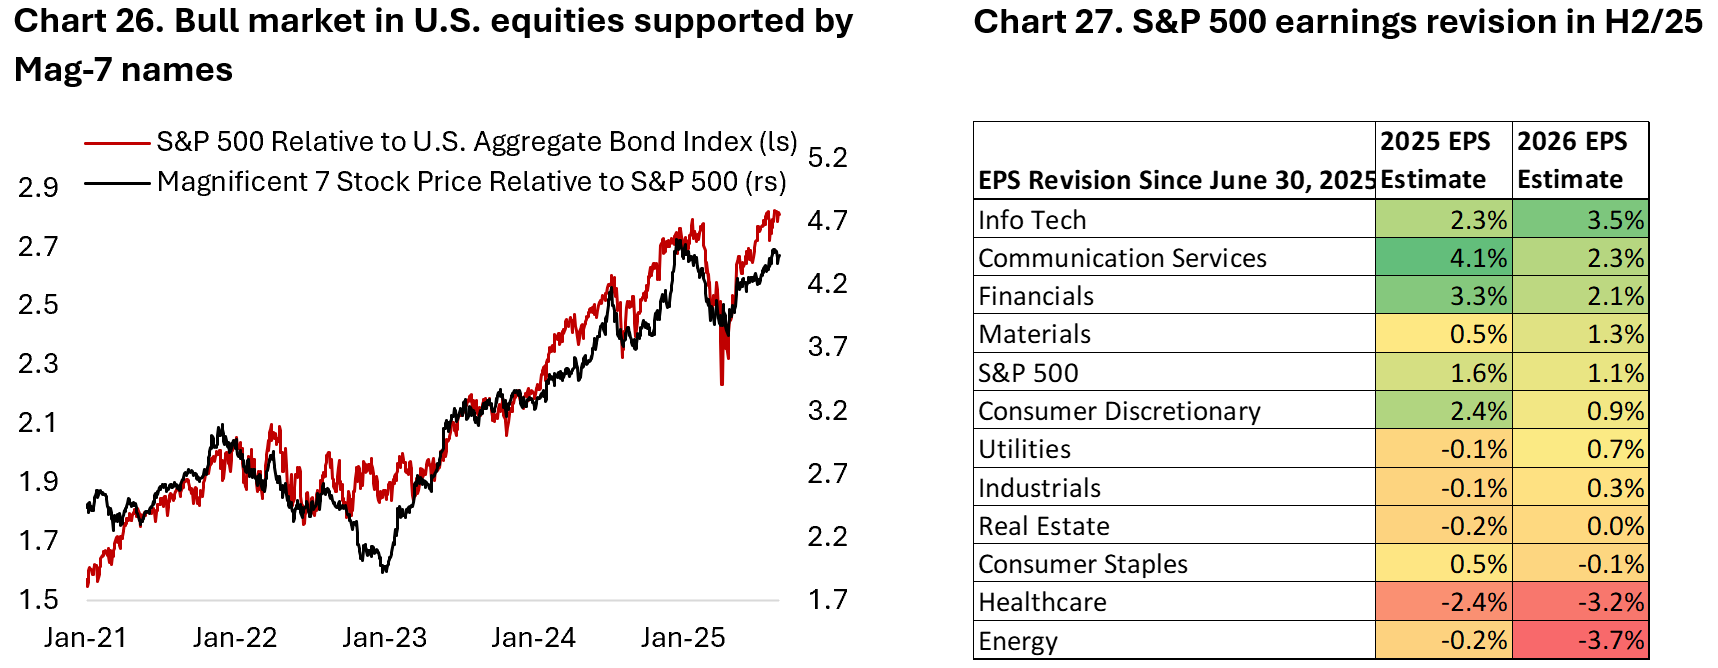
An upswing in the business cycle and Fed easing cycle are two important drivers that historically marked a broadening in equity market. Manufacturing activity has stabilized over the past year but yet to see a clear acceleration amid tariffs uncertainty. Meanwhile, the Federal Reserve last policy rate cut was in December 2024 and only set to resume this month. In hindsight, these two factors contributed to the crowding in anything growth as growth became hard to find (Chart 26 and 27). Meanwhile, the concerns on fiscal sustainability and another inflation shock push investors away from fixed income. These trends have lasted for almost three years now and are likely lived on borrowed time.
Since the beginning of the year we have advocated for greater diversification away from U.S. growth stocks into cyclicals and international equities. The backdrop of slowing consumer spending and downside risk to the labour market, however, mean we are more cautious on consumer-related cyclicals and prefer to overweight industrials and financials. If our view is correct that manufacturing activity will accelerate in the coming quarters, industrials should outperform consumer discretionary sector (Chart 28). A lower yield environment would also provide a tailwind for capital market activity and loan growth, benefitting the financial sector.
What about small and mid-cap stocks? This segment of the market has drastically underperformed with Russell 2000 performance relative to S&P 500 now at a level last seen 25 years ago. Smaller companies have been hit hard by the impact of tariffs uncertainty as most do not have the lobying power of multi-national companies that have direct access to President Trump and his cabinet. Meanwhile, high leverage and interest burden remain an overhang. With the discount in small-cap stock reaching an extreme, however, the bar is low for this segment of the equity market to rebound. Historically, a lower rate environment and the steepening of the yield curve bode well the asset class (Chart 29).

Another potential beneficiary of Fed policy easing cycle is the beaten-down real estate sector. There are still reasons to be cautious on the sector, including slowing demand across property types and over-levered balance sheet, but headwinds for the sector should diminish alongside lower borrowing cost. Chart 30 shows the spread between capitalization rate and U.S. 10-year government yield across different property types is moving closer to their respective long-term average. A further decline of the latter will translate to more attractive valuation for the overall real estate sector.

Furthermore, investors should continue to be invested in international and emerging market stocks, which have outperformed the U.S. so far this year, for several reasons discussed next.
- Why should investors be invested in international and emerging markets? How have they performed?
With fiscal sustainability becoming a focus across developed countries, emerging market’s fiscal outlook is becoming relatively more attractive, and investors have been adding exposure to EM bonds. The continuation of a policy rate cut cycle by the Fed is also historically a tailwind for EM bonds and currencies.
On the equity front, valuation of international and EM equities is also cheaper when compared on a sector level. There are three main reasons why the risk/reward tradeoff for the international market continue to be more favourable compared to U.S. stocks.
First, the U.S. dollar likely have entered a multi-year bear market, which tend to boost the performance of international equities in common-currency terms. Second, earnings revisions have continued to be revised higher across European and Japanese equities, in contrast to U.S. stocks. The upswing in European business cycle should translate to higher earnings power for European companies as well, especially that
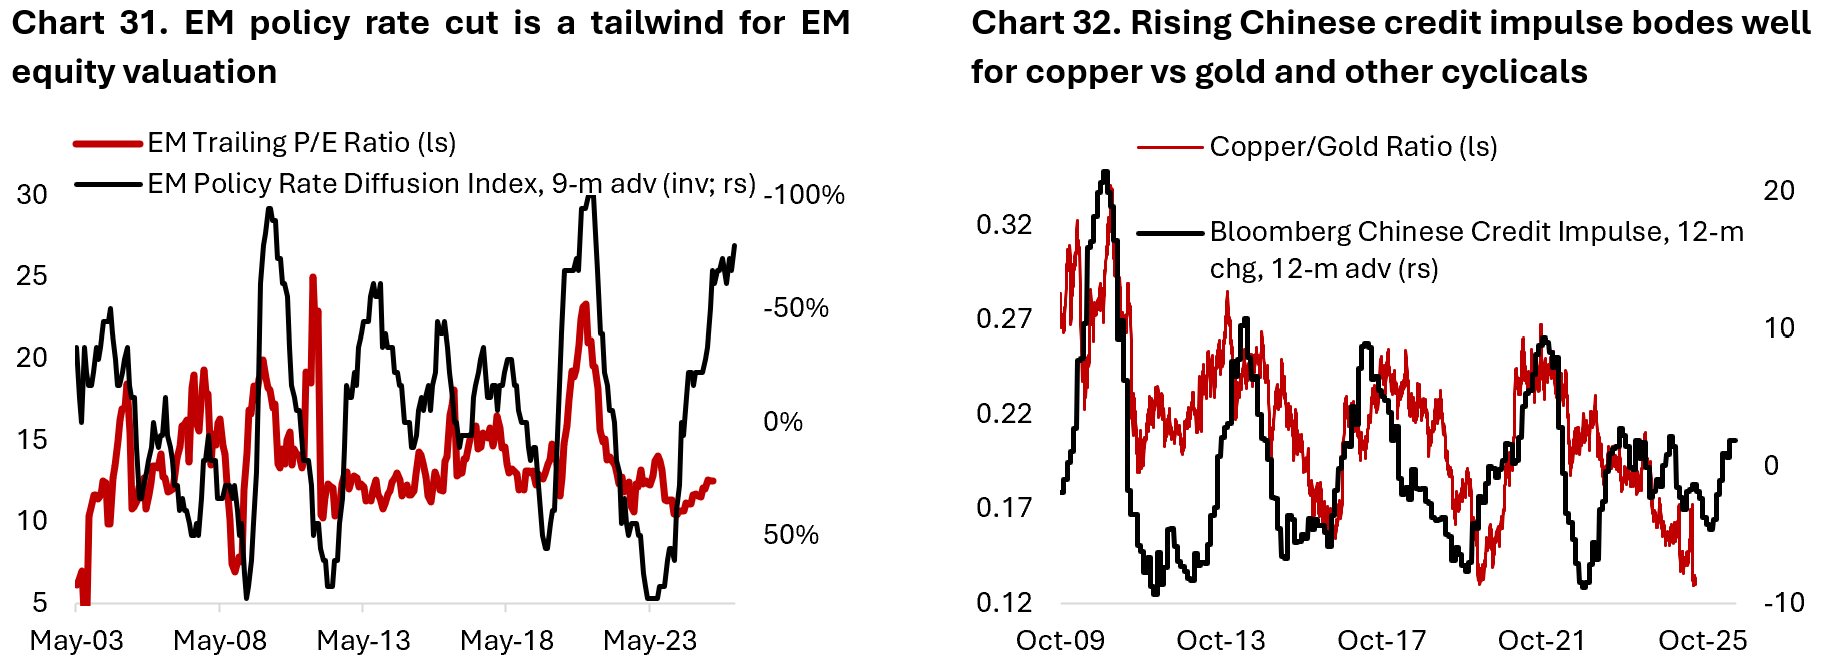
Lastly, valuation for international stocks is still highly attractive from an index level and across ten out of eleven sectors. Granted, international stocks have always been trading at a discount relative to U.S. peers due to lower growth and profit margin, but the current valuation discount is significantly below its median historical level and only slightly narrower compared to the trough seen last December (Chart 33). Given that the earnings outlook for European and Japanese stocks has been revised higher so far this year, multiples could potentially move higher too.

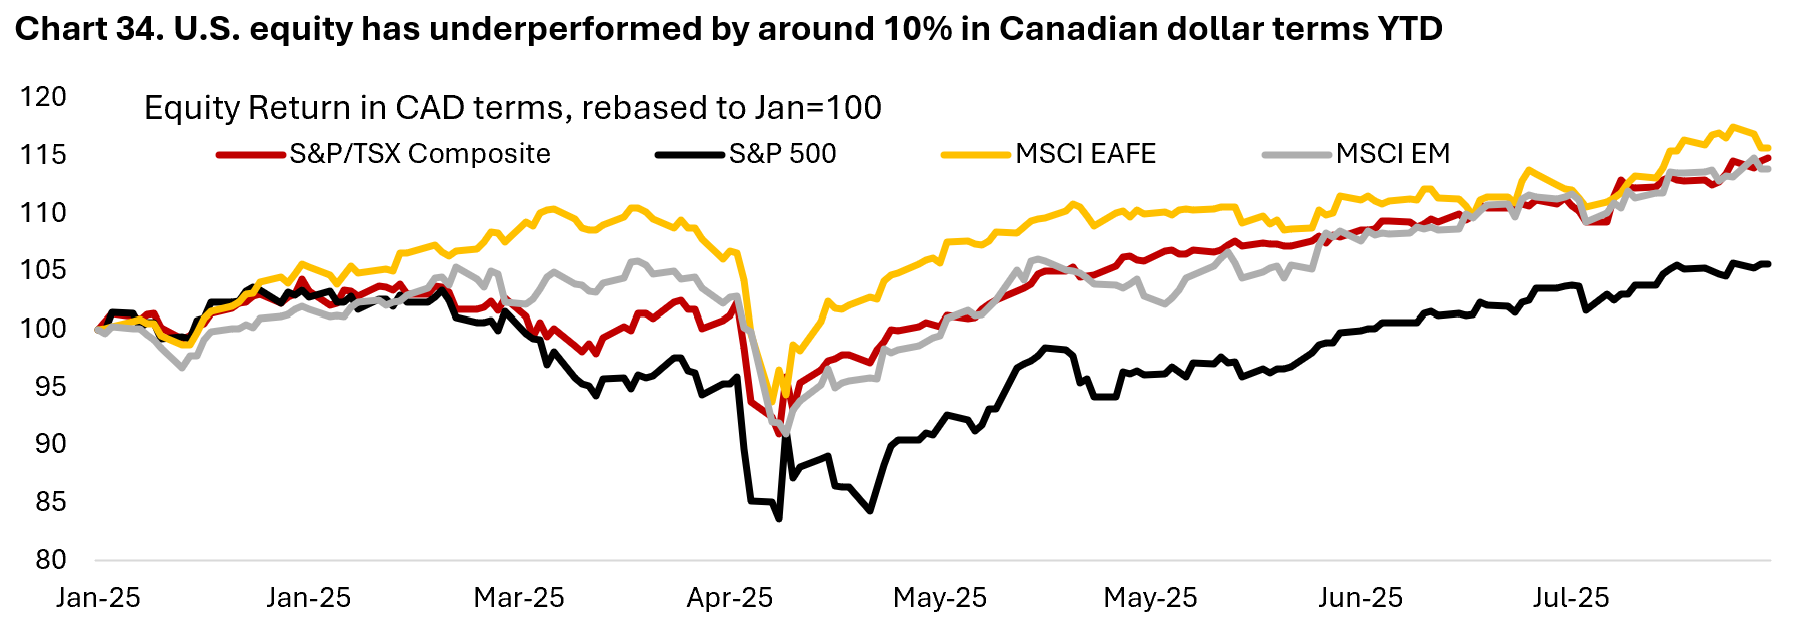
The bottom line is that we think international and EM stocks could further outperform despite the strong run YTD (Chart 34). Upswing in European business cycle should be a tailwind for domestically oriented cyclical sectors such as banks and industrials, which accounts for a large share of its equity market. Meanwhile, policy supports by Chinese authorities and the aim to reverse unhealthy pricing competition in China’s e-commerce market are starting to gain traction. If successful, we have likely seen the worse of Chinese growth slump and commodity demand should pick up from here – benefitting resource-rich EM countries.
- With trade uncertainty declining, will Canadian assets outperform?
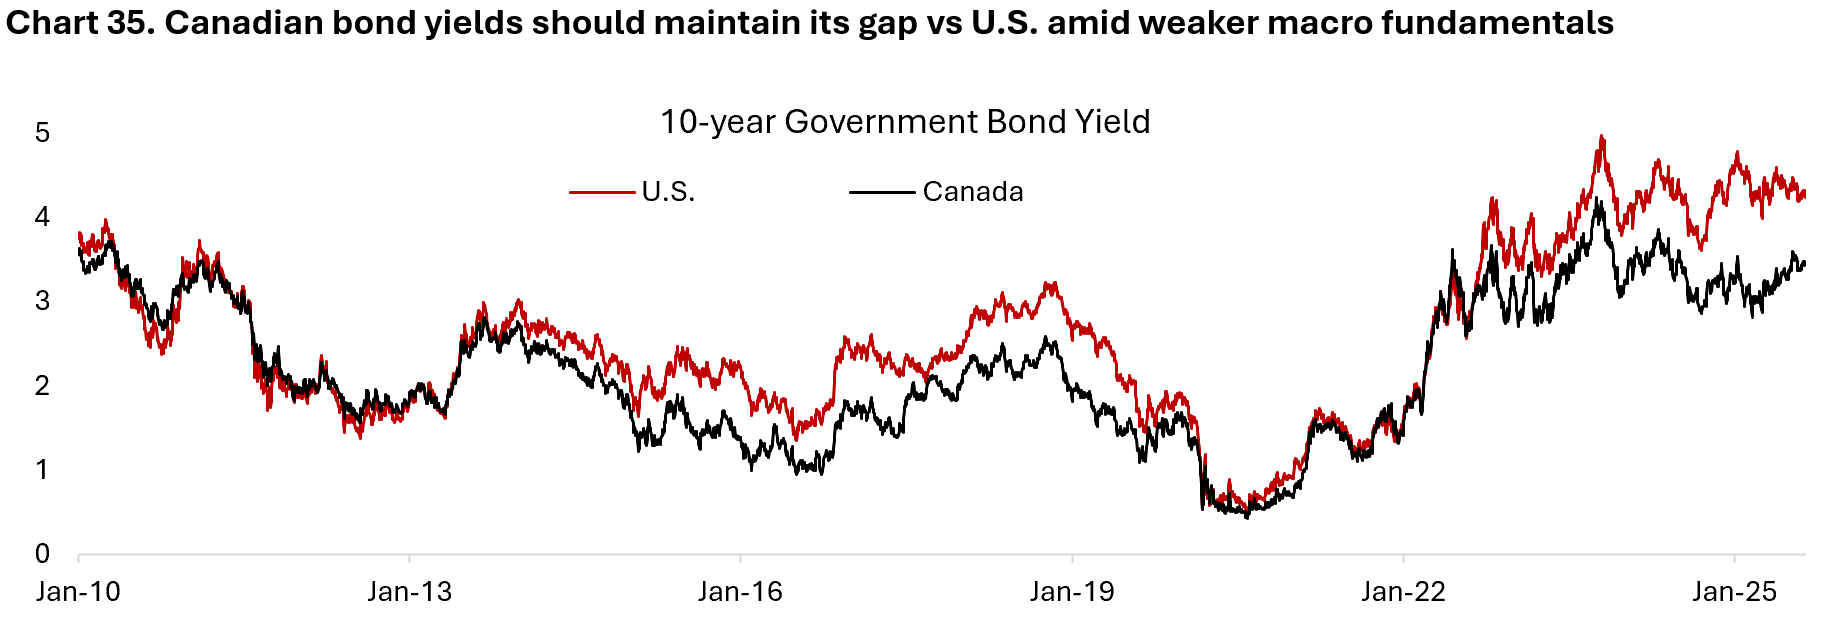
Canadian equity market has outperformed its U.S. counterpart YTD, helped by the weaker greenback. Canadian bonds, however, have underperformed the U.S. Canadian yields are slightly higher compared to at the beginning of the year, mainly due to a more aggressive policy easing cycle by Bank of Canada last year. Meanwhile, yields have started to move slightly lower in the U.S. this year amid rising expectation of Fed rate cuts in more recent months. Following recent convergence between the two, the setup today is more favourable for Canadian bonds – mainly attributed to the weaker labour market outlook and larger tariff impact on the country’s exports, which potentially increase expectation of more rate cuts down the road. In addition, investors are demanding lower risk premium for investing in Canadian government bonds amid lower fiscal deficit and debt level relative to the size of the economy. As a bonus, investor sentiment on the Loonie have likely bottomed and Canadian dollar should resume its appreciation against the greenback.
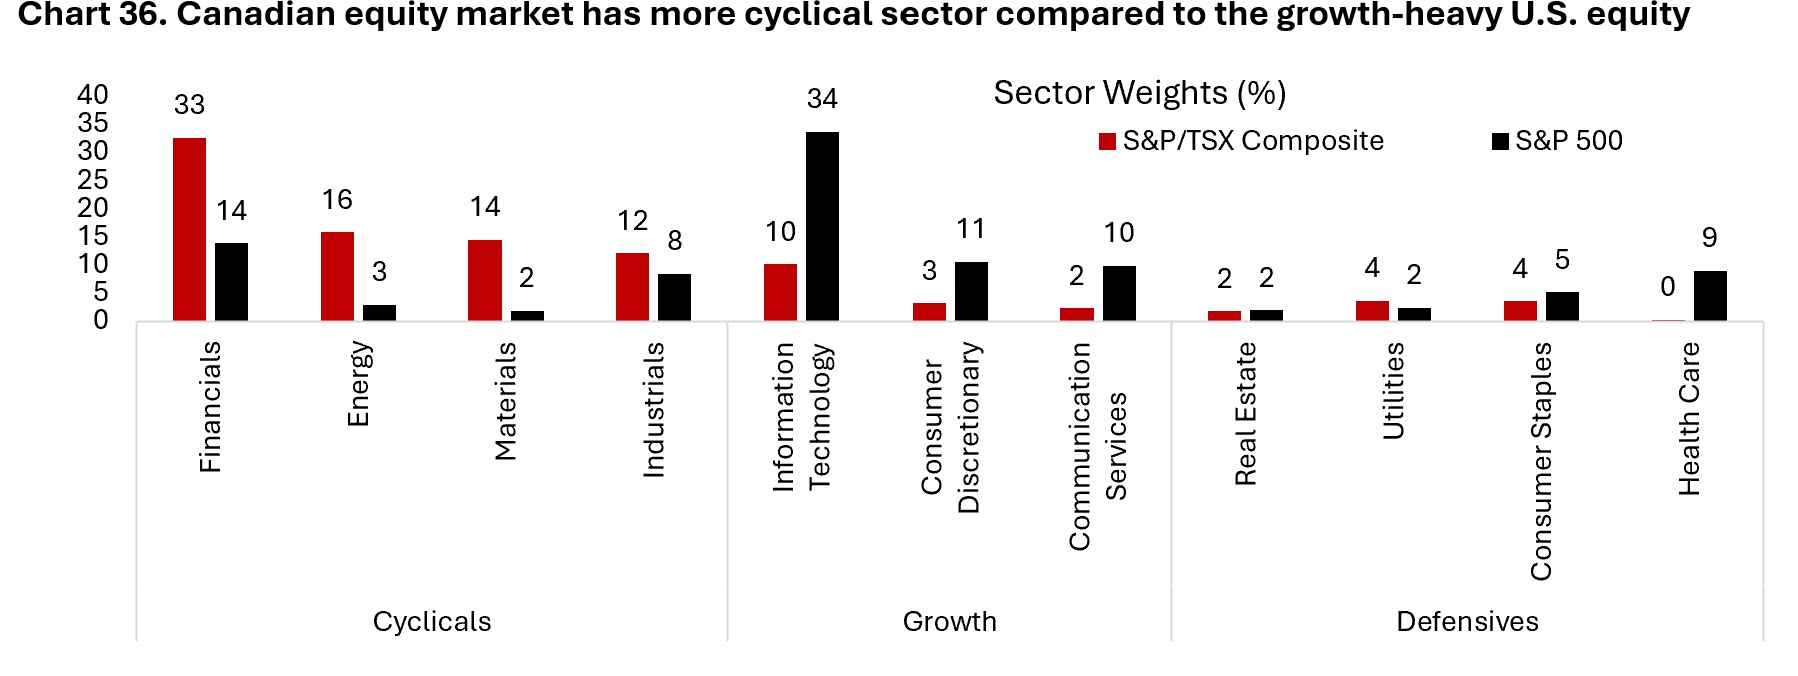
On equities, the outlook for Canadian stocks hinged on the potential upswing in cyclicals, including the manufacturing and housing sector. In the most recent quarter, Canadian banks have seen an acceleration in loan growth and provision for losses seem to have passed its peak – a positive for earnings – while capital market activity is also picking up. From a diversification perspective, Canadian equity universe is highly complimentary to U.S. equity investments that increasingly geared towards AI-related growth stocks. Chart 36 shows that cyclical sectors account for 75% of the S&P/TSX Composite Index vs only 27% for the S&P 500. Meanwhile, growth sector accounts for 55% of U.S. equities and only 15% of Canadian stock benchmark.
- What is the outlook for commodities?
Commodities are a heterogenous asset class, meaning that the underlying constituents have an outlook that varies (Chart 37). For example, we are seeing more downside risk to oil prices currently amid unwinding of OPEC+ production cut and slower global growth, while maintaining a more constructive outlook on copper prices due to demand growth exceeding supply in the coming decade. Another one is gold, which has seen a break in relationship to real yields and the U.S. dollar post-pandemic. With geopolitical tension rising and central banks diversifying their holdings from the U.S. dollar, gold has benefitted tremendously in terms of flow. The varying outlook of commodities is one of the reasons we are advocating an active approach to investing in the asset class.
The outlook for copper prices is attractive given the buildout of renewable energy infrastructure, adoption of electric vehicles and strong demand for semiconductor chips – all of which are expected to provide structural tailwinds for copper demand in the coming years. On the supply side, the long lead time in developing copper mines and declining ore grades have led to slower growth in copper production. Global demand for copper is increasingly met by recycling copper from scraps.

Geopolitical rivalry has also increased the importance of copper, rare earths, and other base metals, which incentivize governments to stockpile inventories of these commodities amid national security concerns. The outlook for oil is more cautious. There are two main reasons why we expect to see limited upside on oil prices in the near to medium term. First, crude oil production in the U.S. continues to hit new highs on rising productivity from technological advancements and new drilling techniques. Second, OPEC members still have significant excess capacity – an estimated 4.2 million bpd – that is gradually being brought into the market. Following a 411.000 bpd increase in May, June, and July, earlier this month OPEC+ decided to ramp up its production by another 548.000 bpd starting in August – higher than the consensus of another 411.000 bpd increase. This will likely result in a less tight supply/demand balance in the oil market
- Volatility-targeting strategies as a portfolio hedge. How much hedging is too much?
As the global equity market is becoming increasingly concentrated – with U.S. stocks accounting for 70% of global market – and valuation for the aggregate market rose, many investors ask the question whether it is time to take some risk off the table and increase their allocation to alternatives mandate with lower beta to the broader market. For investors who have done so over the past two years, sizing the allocation becomes the primary question.
First, mandates with low correlation to traditional stocks and bonds could sharply increase the risk-adjusted return of investor portfolio. For an absolute return mandate such as market neutral and multi-strategy, their performance will depend on the manager’s ability to harvest alpha in the market. For example, Chart 38 shows that market neutral (zero beta target to equity benchmark) mandate tends to perform well in an environment of falling correlation between stocks. In short, these mandates focus on exploiting idiosyncratic risk in the market rather than taking outright macro bets. The main issue is finding managers who could provide this uncorrelated return stream, size their volatility right and hence not becoming a drag to the overall portfolio performance in a bull market. Sharpe ratio – excess return relative to volatility taken – is one of the most common measures used to evaluate managers in this space.
Second, rather than trying to time the market investors could reduce their portfolio volatility by diversifying into mandates with a fixed volatility target. Chart 39 shows various categories of hedge funds alongside the correlation to U.S. equities and their realized annualized volatility. For example, the average equity market neutral mandate has a realized volatility less than 4% and correlation of around 0.7 to the S&P 500. Macro, multi-strategy, and commodity mandates tend to have even lower correlation to the market.
Lastly, most absolute return mandates (except for merger arbitrage) have underlying strategies that are highly diversified across hundreds of securities, reducing the risk arising from concentrated holdings common in long-only mandates. In practice, this means investors are diversifying the driver of their portfolio performance away from bets on only a handful of technology names.
Sizing the allocation for absolute return mandates depends on investors’ access to high-quality managers. Managers that could produce a Sharpe ratio of 0.7 or above with less than 0.3 correlation to the equity market are the most diversifying, but rare to be found. If the focus is to reduce equity market beta, both equity long/short and market neutral strategy could be utilized. For a given correlation to the broader equity market, a 10% allocation to equity market neutral strategy with near-zero beta should have a comparable outcome to a 20% allocation to equity long/short strategy with 0.5 beta to market. But as always there are nuances that are important in determining the optimal allocation, especially as it relates to performance fees calculation and the hurdle rate for each mandate.

Copyright © 2025, Putamen Capital. All rights reserved.
The information, recommendations, analysis and research materials presented in this document are provided for information purposes only and should not be considered or used as an offer or solicitation to sell or buy financial securities or other financial instruments or products, nor to constitute any advice or recommendation with respect to such securities, financial instruments or products. The text, images and other materials contained or displayed on any Putamen Capital products, services, reports, emails or website are proprietary to Putamen Capital and should not be circulated without the expressed authorization of Putamen Capital. Any use of graphs, text or other material from this report by the recipient must acknowledge Putamen Capital as the source and requires advance authorization. Putamen Capital relies on a variety of data providers for economic and financial market information. The data used in this publication may have been obtained from a variety of sources including Bloomberg, Macrobond, CEIC, Choice, MSCI, BofA Merrill Lynch and JP Morgan. The data used, or referred to, in this report are judged to be reliable, but Putamen Capital cannot be held responsible for the accuracy of data used herein.
