For the past fifteen years, U.S. assets are the only thing that matters. Foreign investors require little risk premium for investing in U.S. government bonds, which was and still is de facto safe-haven assets, and bid valuation for U.S. stocks higher. As we will discuss in the second part of this piece, comparable sector valuation for U.S. equity is on average 20-30% higher compared to European and Japanese stocks, and some of these sectors have similar return on capital compared to its U.S. counterpart. A more chaotic policies out of the current U.S. administration, however, have left investors wondering if this safe-haven status is still warranted especially considering American fiscal trajectory is now on an unsustainable path.
With governments across Europe and Asia questioning the security guarantee U.S. provided to its allies, these countries are now taking things into their own hand, starting with defense policy and building an alternative financial system. Foreign central banks have also accelerated their pace of diversifying their reserves into other currency majors outside the greenback and adding gold. Meanwhile, the cost of hedging U.S. dollar assets into local currency remains prohibitive given short-term policy rate in the U.S. stays elevated. For example, U.S. 10-year treasury is now yielding around 4.5% and the cost of hedging USD to Japanese Yen is around 4.0%. For Japanese investors, this translate to a hedged yield of only 0.5%, which is unattractive given the equivalent Japanese 10-year bond is yielding 1.55%. Hence, barring the Fed cutting its policy rate faster, foreign investors require higher term premium for investing in longer term U.S. bonds (Figure 1).
If tariffs are effective in solving the trade imbalance, then tariffs during President Trump’s first term should be followed by narrowing trade deficit. In fact, the reverse has happened. US trade deficit widened from ~$45bn in 2018 to ~$140bn today (Figure 2). This is because the US private savings has fallen behind investment, hence the need foreigners to “subsidize” US consumption. The more effective way to reduce trade deficit is actually to cut government deficit, as the latter contributed to the strong domestic demand post-pandemic.

In a way, we are still paying the cost of the pandemic as government fiscal stimulus and hence increase in public debt level is now compounded by higher borrowing cost. This double-whammy contributed to today’s problem of debt sustainability and is one of the reasons investing in long-term bonds has been painful. Figure 3 shows IMF forecast of primary and overall fiscal balance for the U.S., Canada, and the average of G7 countries. The U.S. is unique due to its primary (excluding interest payment) balance expected to stay negative in the coming five years and hence its overall fiscal balance also staying near the current level of around 6% of GDP.
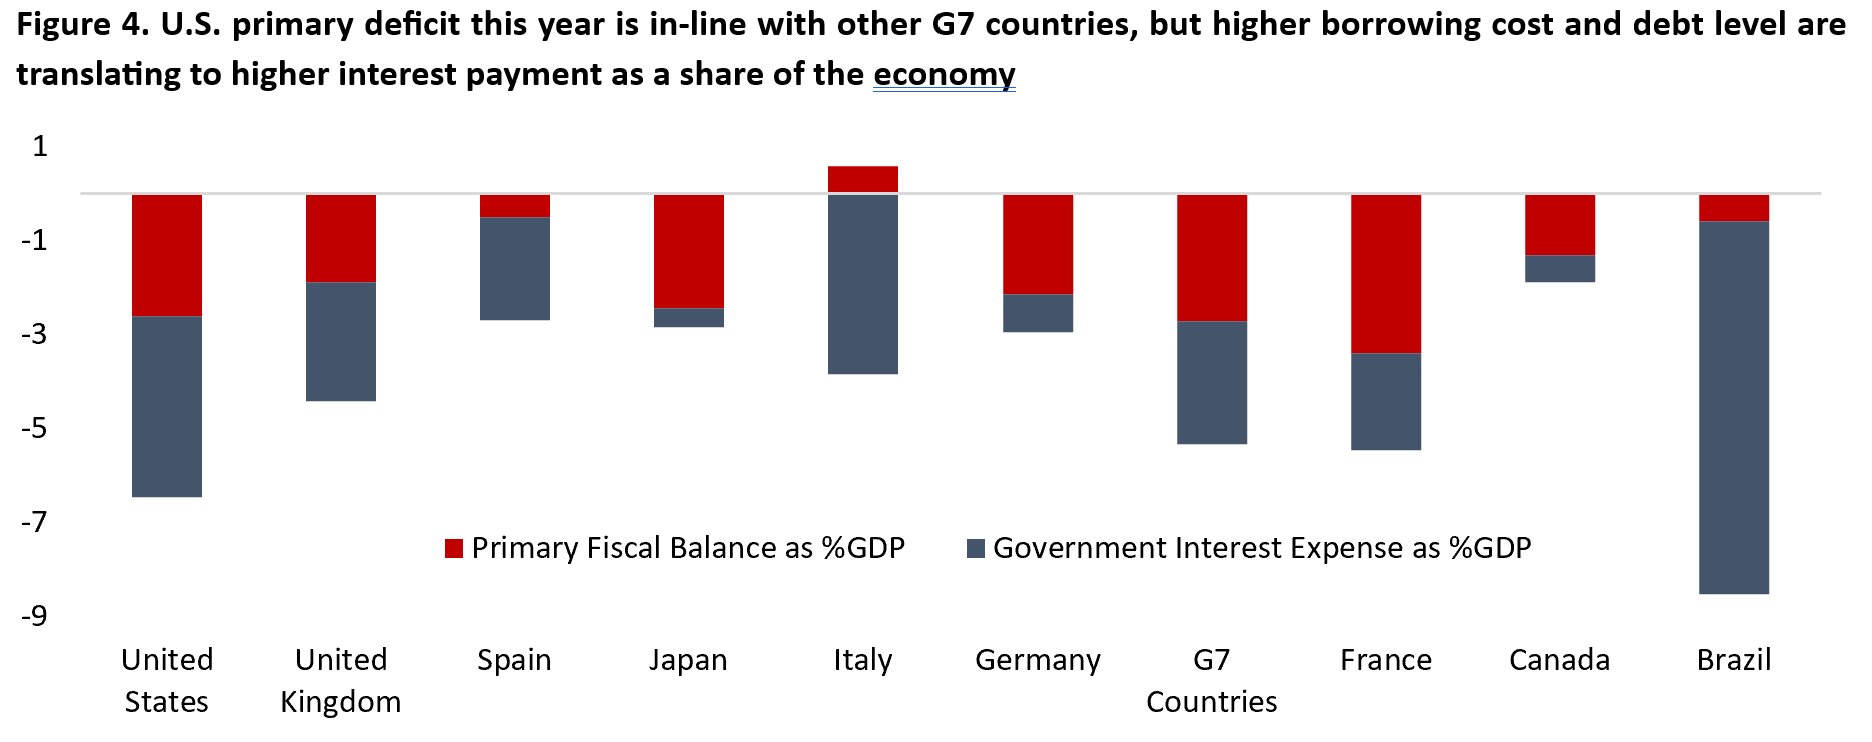
Unless the Federal Reserve start to cut policy rate significantly – and they have little reason to do so right now given the battle on inflation is not done yet and the labour market remains decent – the U.S. government will continue to see its borrowing cost rising. This year the U.S. government is estimated to pay 3.9% of GDP worth in interest expense, similar to in Italy and half of those of Brazil (Figure 4). For most countries, this should mean that the government will have to both cut its spending and raise taxes similar to what Italy, Spain, Portugal, and Greece did following the Euro Crisis in 2011. The U.S. is different to other countries due to control of its own monetary policy and currency reserve status, but foreign investors are balking at the prospect of financing American spending at a time when American policies are turning hostile against their own country.

In addition, the current administration is testing the limit of American exceptionalism by staying on spending and cutting taxes for both corporates and individuals. On a standalone basis, the extension of tax cuts is estimated to add $4 trillion (13% of 2024 GDP) to U.S. deficit between 2025 and 2034. President Trump hope to counter some of this by the revenues raised from tariffs. Similar to during his first term, this policy combination will translate to widening inequality as tariffs impact will hit lower-income households harder and tax cuts will disproportionately benefit the wealthy.
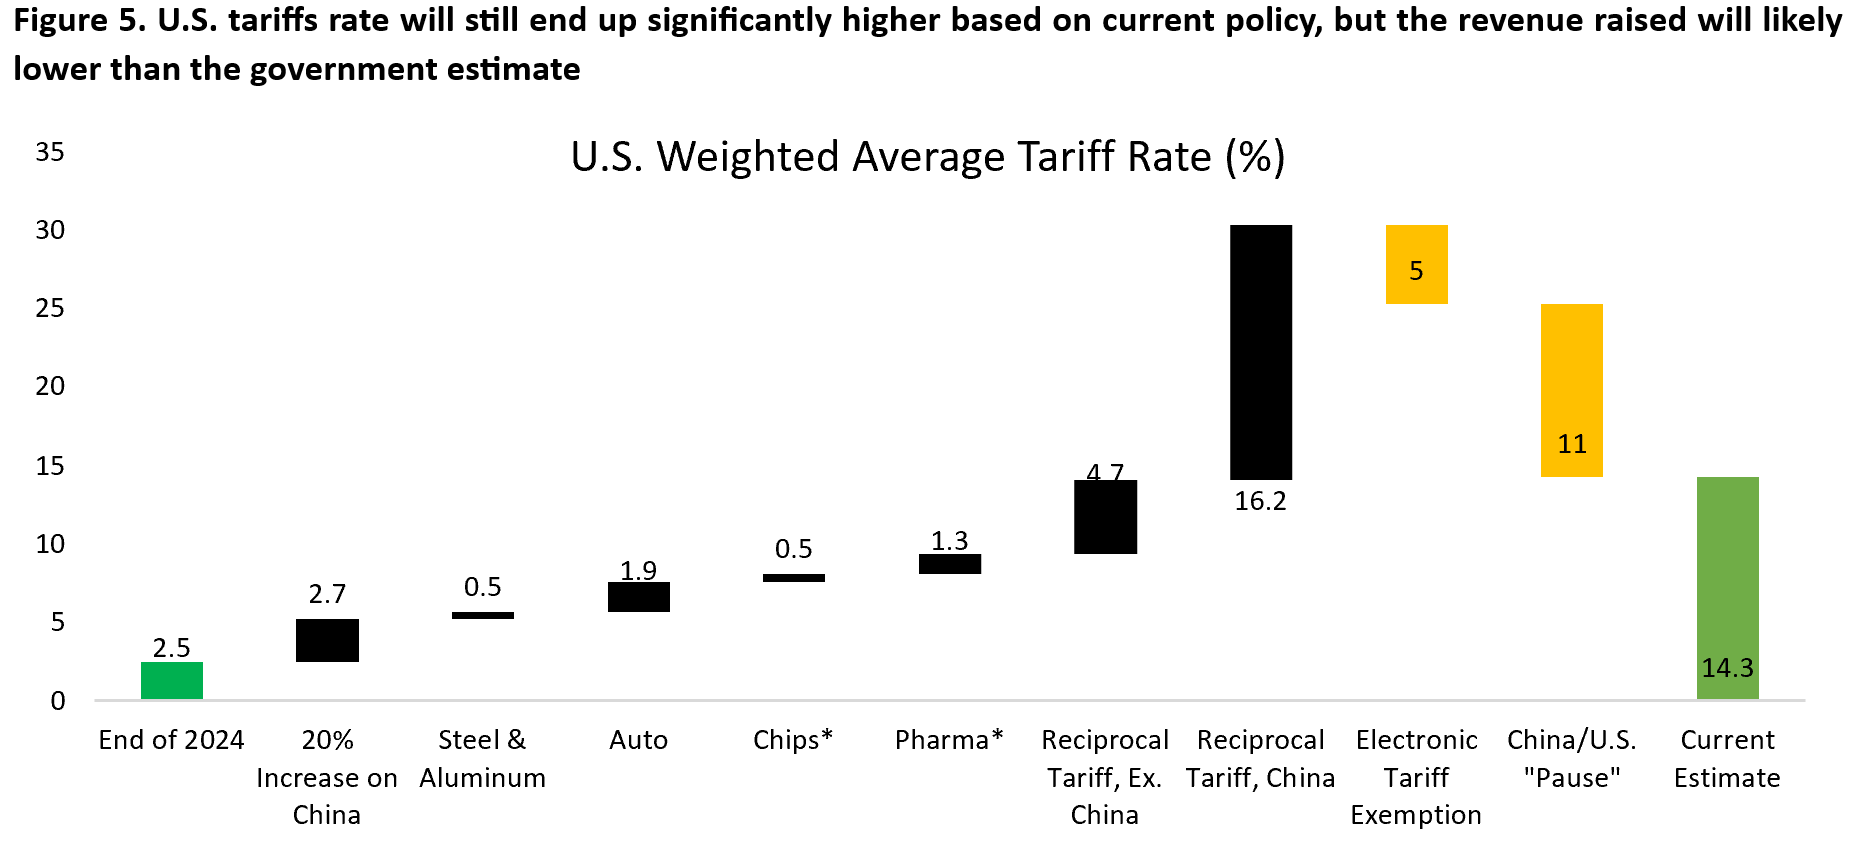
Given the early stage of tariffs negotiations, the estimate of revenues raised is changing by the day. In Figure 5 we broke down the the weighted-average tariffs rate for U.S. imports, which totaled $3.3 trillion in 2024. Assuming the electronic goods exemption and current U.S.-China pause become permanent, the U.S. government is expected to raise a paltry $470 billion yearly or equivalent to 1.6% of GDP. And that assumes there is no import substitution and inelastic demand, meaning that the actual revenue raised is likely smaller than this. At best, the net impact of both the proposed tax cuts and tariffs raised is neutral. More likely, it is negative from fiscal perspective.
Although the U.S. fiscal issue is clearly affecting the bond market, the equity market is back to party mode. The S&P 500 is now back to trading at 22x forward earnings and only slightly below its all time high amid the lure of earnings boost from corporate tax cuts and lower tariffs uncertainty. Our fear/greed measure – an aggregate of dozens technical indicators such as breadth, RSI, VIX, MOVE, and spreads across different market – is back to near the high. Given that we think the upside on U.S. equity is limited, this brings us to….

The Case for Going International
U.S. equities have rebounded strongly over the past one month as news flow on tariffs negotiation lift investor sentiment higher from a depressed level. However, the U.S. dollar has continued to trade weaker and European and Japanese stocks have kept up with the rally in U.S. stocks. Technology stocks, sold off last month during the height of the escalation on tariffs, are now back leading the U.S. equity index higher as retail investors bought the dip. We remain cautious on the consumer goods sectors that are most vulnerable to the impact of tariffs and underweight both consumer discretionary and staples in the portfolio. There are three main reasons why the risk/reward tradeoff for the international market continue to be more favourable compared to U.S. stocks.
First, the U.S. dollar likely have entered a multi-year bear market, which tend to boost the performance of international equities in common-currency terms (Figure 1). The U.S. dollar weakness is oversold following the sharp decline this year, but it remains expensive and overvalued relative to its trading partner, adjusted for inflation differential. Moreover, the recent volatility in Taiwanese Dollar highlights global long-term institutional investors such as pensions, insurance companies, and sovereign wealth funds are now looking to diversify their holdings away from the dollar.

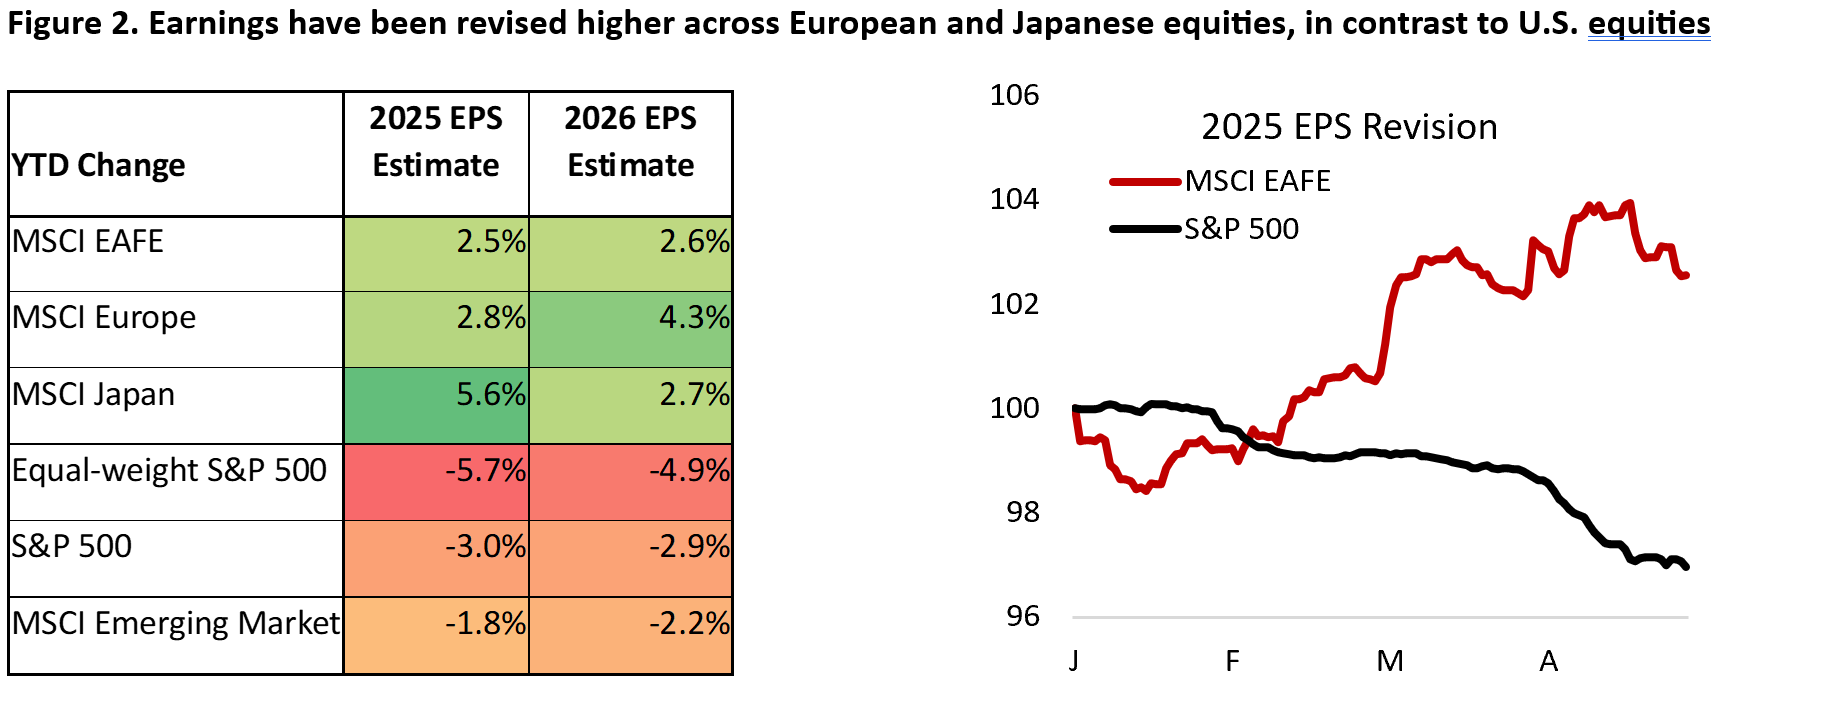
Second, earnings revisions have continued to be revised higher across European and Japanese equities, in contrast to U.S. stocks (Figure 2). European Central Bank has cut its policy rate more aggressively than Federal Reserve and Germany – the continent’s largest economy – is now stimulating through series of fiscal packages aimed at bolstering the government’s investment and defense spending. In the long run, this should translate to an improved productivity for the region. In the shorter term, it will likely bolster earnings and profit margin for the private sector. The rally in European defense firms have reflected some of this optimism, but other industries including telco, industrials, and banking will also benefit.
Lastly, valuation for international stocks is still highly attractive from an index level and across ten out of eleven sectors. Granted, international stocks have always been trading at a discount relative to U.S. peers due to lower growth and profit margin, but the current valuation discount is significantly below its median historical level and only slightly narrower compared to the trough seen last December (Figure 3). Given that the earnings outlook for European and Japanese stocks has been revised higher, multiples could potentially move higher too.

U.S. stocks remain expensive across many sectors, but forward earnings multiples are now broadly lower compared to at the beginning of the year. Consumer staples is the only sector that saw a significant rise in valuation multiple amid the strong capital flow to the sector as investors turned defensive. This is likely overdone given the sector’s valuation now trading at the 98th percentile (Figure 4). The risk/reward of the sector is deteriorating amid weaker consumer spending outlook and the potential disruption from U.S. tariffs. We trimmed the portfolio’s allocation to consumer staples and added to communication services, which has a defensive growth tilt given the balance mix of both technology stocks – through the exposure of Netflix, Alphabet, and Meta – and high yielding names in the sector. In addition, communication service sector is the only sector that have seen positive earnings momentum this year, in contrast to the downward earnings revision seen across other sectors.

Finishing the earnings season, management guidance and commentary skew cautious in general as policy uncertainty related to tariffs and its impact to consumer spending pose downside risk to economic growth. Fear of recession is still lower compared to in 2022, which proved to be a false alarm (Figure 5) and revenue and earnings growth have held up well in the first quarter. However, the number of companies that raised guidance this quarter is significantly lower to historical average which reflect the negative earnings revision YTD.

Coming into 2025, we were optimistic that the U.S. and global economy will see an upswing in the business cycle as manufacturing activity recovers while the service sector continues to slow albeit growing around trend. This narrative has been disrupted by the tariffs announcement and the uncertainty related to potentially weaker consumer spending and labour market. Now that the trade war is on a de-escalation phase, the downside risk is diminished somewhat.
The macro setup is similar to in 2022 when fear of recession/economic slowdown increased amid sharp deterioration in soft data. In hindsight, the U.S. labour market and consumer spending were simply too hot for the economy to turn into a recession. Today, we still have a healthy backdrop for the U.S. economy with low unemployment rate and resilient domestic demand, but the base is softer compared to two years ago. The recent climbdown on tariffs between U.S. and China means the probably of recession has declined further, but a U.S. growth slowdown is still the base case.

Meanwhile in Europe, economic activity seems to be accelerating. In February, which seems like a long time ago, we highlighted that the headwinds for the European economy are reversing:
In hindsight, European countries have been facing three strong headwinds over the past three years: high interest rate, high energy prices due to the war in Ukraine, and weak global manufacturing activity.
First, the ECB has cut policy rate by 160 bps since June 2024 and is expected to reduce it by another 75 bps by the end of this year…
Second, oil and energy prices have normalized and OPEC+ excess capacity is now estimated to be around 5 million bbl/d or equivalent to ~5% of global oil supply. Since last year, the group has postponed its plan to reverse its supply cut multiple times to prevent oil prices from dipping below $65 per barrel, highlighting the downside risk to oil price amid surging U.S. crude oil production.
In addition, President Trump’s policy for an end of the war in Middle East and Ukraine is forcing both sides – exhausted from years of war – to reconsider their position and make ceasefire a compelling option…
Lastly, we are seeing budding upswing in the global business cycle… European manufacturing and construction PMI is ticking higher, and China’s economy is showing signs of stabilization. All these suggest improving outlook for the cycle-sensitive European economy.
This playbook has played out nicely and has more legs, in our view, despite the U.S. equity also rebounding sharply higher (Figure 7). The ECB is still on rate-cutting mode, OPEC+ plan to boost oil production is pushing WTI oil price falling to around $60/bbl from as high as $82/bbl at the beginning of year, and geopolitical and equity risk premium on European assets is declining as the continent’s outlook improves.

Copyright © 2025, Putamen Capital. All rights reserved.
The information, recommendations, analysis and research materials presented in this document are provided for information purposes only and should not be considered or used as an offer or solicitation to sell or buy financial securities or other financial instruments or products, nor to constitute any advice or recommendation with respect to such securities, financial instruments or products. The text, images and other materials contained or displayed on any Putamen Capital products, services, reports, emails or website are proprietary to Putamen Capital and should not be circulated without the expressed authorization of Putamen Capital. Any use of graphs, text or other material from this report by the recipient must acknowledge Putamen Capital as the source and requires advance authorization. Putamen Capital relies on a variety of data providers for economic and financial market information. The data used in this publication may have been obtained from a variety of sources including Bloomberg, Macrobond, CEIC, Choice, MSCI, BofA Merrill Lynch and JP Morgan. The data used, or referred to, in this report are judged to be reliable, but Putamen Capital cannot be held responsible for the accuracy of data used herein.
