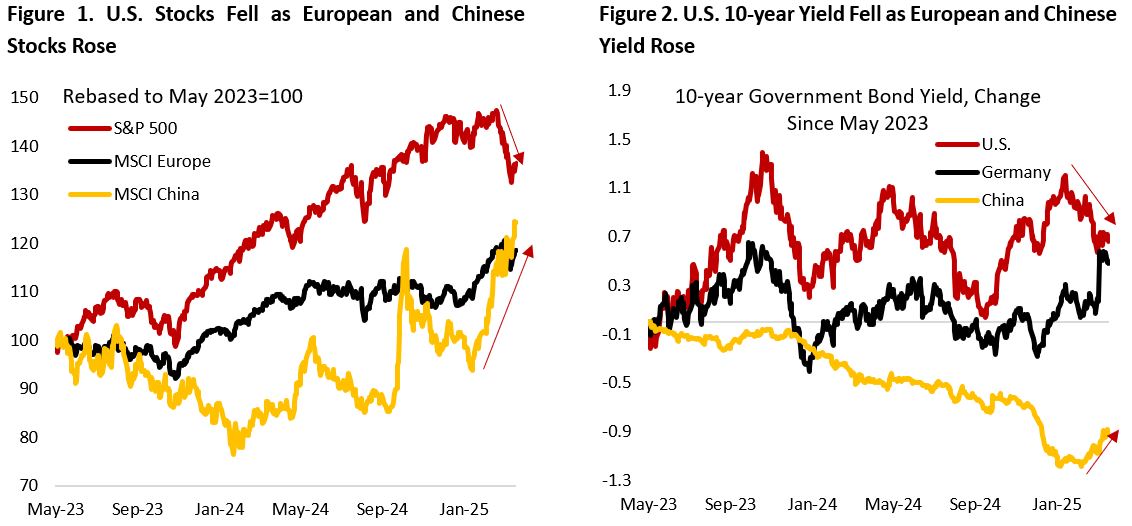
One of the themes that could be observed in both the global equity and bond market is the convergence between U.S. and the rest of the world. Following two years of strong U.S. economy and weak growth in the rest of the world, we have seen U.S. exceptionalism start to diminish amid continued softening in the labour market and signs of pullback in consumer spending – discussed in greater depth below. Meanwhile, governments in Europe and China have announced fiscal stimulus to boost their ailing domestic economy. Even as U.S. equity has seen a correction this year, the rest of the world has delivered positive returns (Figure 1).
German government bond yields have risen sharply amid the proposal to exempt defense spending above 1% of GDP from the country’s fiscal limit and loosen debt rules for states, all the while setting up a €500bn off-balance sheet vehicle for debt-funded infrastructure investment. Under the new leadership of Chancellor Friedrich Merz, Germany is having its “whatever it takes” moment to revive the continent’s growth, which in the past decade has seen a sharp increase in the popularity of the far-right movement. The historic bill, which already passed the upper house of German parliament, could potentially translate to an additional 2% of GDP fiscal stimulus annually, including increase in public investments that enhances the economic outlook for Germany. The positive impact is likely to ripple across other European countries as well given the tight link between Germany and many Eastern European countries. The market sees all these proposals as credible and likely change the outlook for European assets, as highlighted by the jump in borrowing cost (Figure 2).
Tit-for-tat and chaotic tariff announcements have left investors on the edge of their seats as the market gyrate on the announcement, escalation, and postponement of tariffs – sometimes within the count of days, if not hours. If President Trump’s policy in the first 100 days is a sign of what to come for the next four years, investors should get used to a more erratic U.S. policy that potentially disrupt the existing global order, spanning from trade, rule of law, and the relationship between America and the rest of the world. All these could translate to a sharp swing of the financial market – making it even more important today that investors own assets with negative or zero correlation to their traditional portfolio and ensure adequate diversification within both their equity and fixed income allocation.
The correction in U.S. equity market over the past month remind investors three important lessons in finance.
First, a well-diversified portfolio is superior in weathering financial market volatility. This is akin to a boat fitted with fins and gyro stabilizer, which reduces the rocking motion of the boat caused by waves, currents, or winds, and hence helps minimize seasickness for its passengers (read: investors). Fortunately, this time we saw fixed income again playing its role as portfolio diversifier with correlation to equity turning negative. As concerns on economic growth is offsetting the worries on inflation amid tariffs and other U.S. government policies, we could see the utility of fixed income allocation potentially increase. Within equities, allocation to international and emerging equities have also helped as European and Chinese economic outlooks improved and their equity markets rallied hard.
Second, chasing a crowded positioning is rarely a good idea. Long mega-cap tech stocks have been a consensus trade for a long time throughout 2024 and positioning had become extended as passive flows and the impact of leveraged ETF rebalancing push these favourite names higher. At the last leg of this momentum trade, active managers have also chased these stocks higher amid the fear of underperforming the benchmark. See Box 1 for more details. The problem with chasing a crowded trade is that even if investors enjoyed some of the tailwind, they are unlikely to get out just in time prior to the crash.

Third, it pays to be a contrarian. After a tremendous run over the past decade, perhaps investors have become complacent in their asset allocation and overlook the brewing trouble underneath. Figure 3 ranks the Sharpe Ratio (the ratio of an asset excess return over cash divided by its volatility) over the past ten years across various asset class under three broad categories: alternatives, equities, and bonds. U.S. equity and high yield bonds, which topped the rank in their respective category, are no longer cheap with valuation multiple elevated and spreads still near record low level. Meanwhile, the high Sharpe ratio for private debt is inflated by the seemingly low volatility number that is not reflective of the inherent risk of the asset class. We have also seen rising payment-in-kind (PIK) as a share of total investment income – a loan feature that allows a borrower to defer regular interest payments by adding the interest to the principal balance of the loan – which may mark deteriorating quality of the portfolio. On the contrary, U.S. Treasury. Chinese equity, and commodities – all on the bottom rank of their respective category – has done well YTD.
Box 1: The Impact of Elevated Concentration Risk and Momentum Crash in U.S. Stock Market
Elevated policy uncertainty, greater downside risk to the U.S. economy, and crowded positioning have translated to a rotation away from the mega-cap tech names and momentum and growth stocks. From a factor lens, the largest drawdown in U.S. equity could be seen in the momentum basket that has outperformed significantly in 2024. Meanwhile, low volatility factor, which lagged the U.S. equity index last year, outperformed so far this year and is now in-line with the S&P 500 performance since January 2024. Value factor has also done slightly better, with the equal-weight S&P 500 being -0.7% YTD while the market-cap-weight counterpart is down 3.7% (as of March 20, 2025).
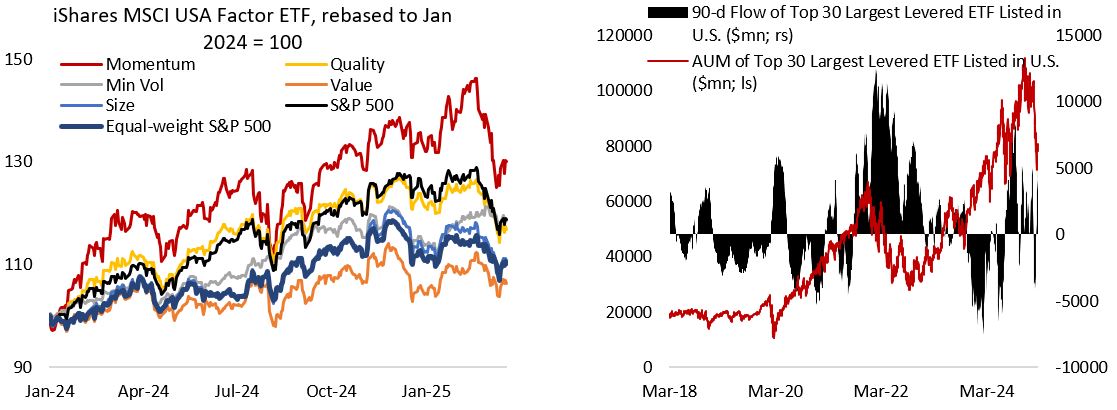
In addition, the introduction of leveraged ETF products in the past few years that offer two or even three times the daily return of a particular stock or basket of stocks further bolstered demand for stocks that are popular among individual investors.
To quantify how much of the market correction has been driven by this crash in momentum, we look at the top 30 holdings for iShares MSCI USA Momentum Factor ETF – the largest U.S. ETF (US$14.2 billion) tracking a basket of stocks considered under the momentum category. All the names in this list should be familiar to investors, either because they have been among the winners over the past two years or due to their large market capitalization and hence weight in the S&P 500. Taken together these 30 names under the momentum category accounts for 25% of S&P 500 index weight and contributed to over half of S&P 500 return this year.
The boom in levered ETF products that offer two or even three times the daily return of a particular stock or basket of stocks further bolstered demand for popular stocks during the bull market. This has translated to strong growth in the asset under management (AUM) of levered ETF, driven by both capital inflow and stock price appreciation. The chart below shows the AUM and 3-month trailing flow of the top 30 largest levered ETF listed in the U.S., which has fallen from $108bn at the peak last December to $78bn today. During the 2022 correction in U.S. stocks, individual investors increased their purchase of levered ETFs as the equity market decline. Today, we have not seen similar phenomenon happening.
The difficult part of being a contrarian investor is being stuck in a value trap, as had been the case for investing in international and emerging market equities in the past decade. But low expectation and a strong positive catalyst means the bull market in these markets could have legs, despite the sharp jump already seen of late.
Figure 4 shows that the business cycle in U.S., Europe, and Japan continued to inflect higher in February, whereas it relapsed in Canada and China. Elevated policy uncertainty, however, has increased the left tail risks to the budding cyclical recovery in these regions. After a sharp rally in January, the ISM manufacturing new order/inventory ratio has pulled back in February as waves of tariffs announcements weigh on business optimism. It is one of many early signs that businesses are postponing their investment plan amid all tit-for-tat tariffs between U.S. and its trade partners.
On China, although growth outlook and consumer sentiment remain downbeat, it is important to acknowledge that the real estate market and broader economy has largely stabilizes. After pushing for a supply-side reform for three years, Chinese policymakers changed tack this year and will focus on boosting consumption, with pledges to increase the minimum wage, strengthen support for education and establish a subsidy system for childcare. On top of the stock market rally, the announced policies have boosted consumer sentiment. Data shows China’s retail sales rose 4.0% y/y in January and February, beating a 3.7% increase in December, while industrial output grew 5.9% y/y, slowing from 6.2% but beating analysts’ expectations of a 5.3%.

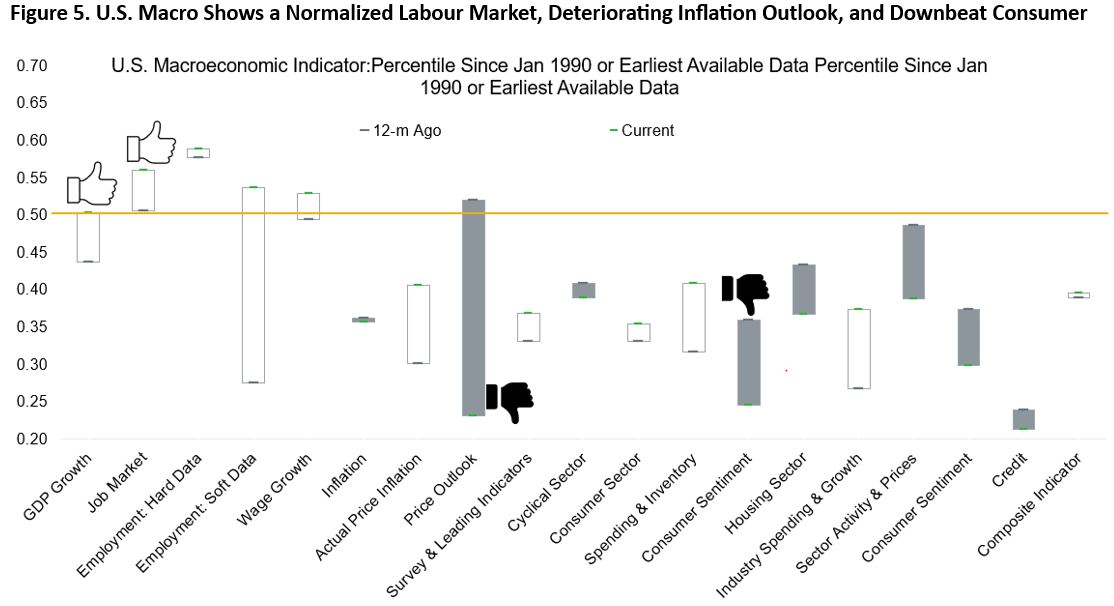
The U.S. economy also remains in decent shape, although the trend for inflation outlook and consumer sentiment is worrisome (Figure 5). Whereas we have been in goldilocks environment in much of 2023 and 2024 with inflation trending down and real GDP growth above the 2% trend, this year we could see inflation being stickier on the 3% handle and growth slipping to below 2%. Recent University of Michigan survey shows the median respondent think inflation will rise to 4.9% in the coming year, which amounts to a sharp acceleration from current level, and more respondents expect unemployment to be higher in the coming year. Unlike in the vibecession of 2022, the risk today is larger given the tailwinds of excess savings and fiscal stimulus is now on the rear-view mirror.
U.S. GDP growth is currently still estimated to be around 2.2%, close to the long-term trend of 2%, according to Dallas Fed Weekly Economic Index that track the four-quarter moving average of real GDP growth. Much of the strength in U.S. economic growth over the past year hinged on the resilience of consumer spending, in which 40% of the total is driven by the top 20 percentile of household by income (Figure 6). But now we are seeing that higher-income households are also starting to pullback discretionary spending, which pose downside risk to growth this year. This is exemplified by Delta Air Lines, which slashed its first-quarter profit estimates by half and said that travel demand has softened.

Given the already normalized U.S. consumer spending and the labour market (Figure 7), further softening on either front will not be welcome by the Fed and risk assets as it implies real GDP growth running below potential. Figure 8 shows Indeed job posting indicator is now only slightly above pre-pandemic level, which corroborate the Atlanta Fed wage growth tracker showing the premium for moving jobs (4.8%) vs staying (4.6%) have largely diminished (at the peak in early 2023, the premium for job switchers is much large at 7.7% for job switcher vs 5.5% for stayer).

The two biggest risks to the U.S economy today comes from further deterioration in employment outlook and a pullback in government spending, which seems to be the goal of Department of Government Efficiency (DOGE) led by Elon Musk. President Trump’s aim to reduce government spending is in part to push through his proposal for corporate tax cut. Given the lower growth multiplier from tax cuts compared to direct government spending, however, this will translate to lower GDP growth.
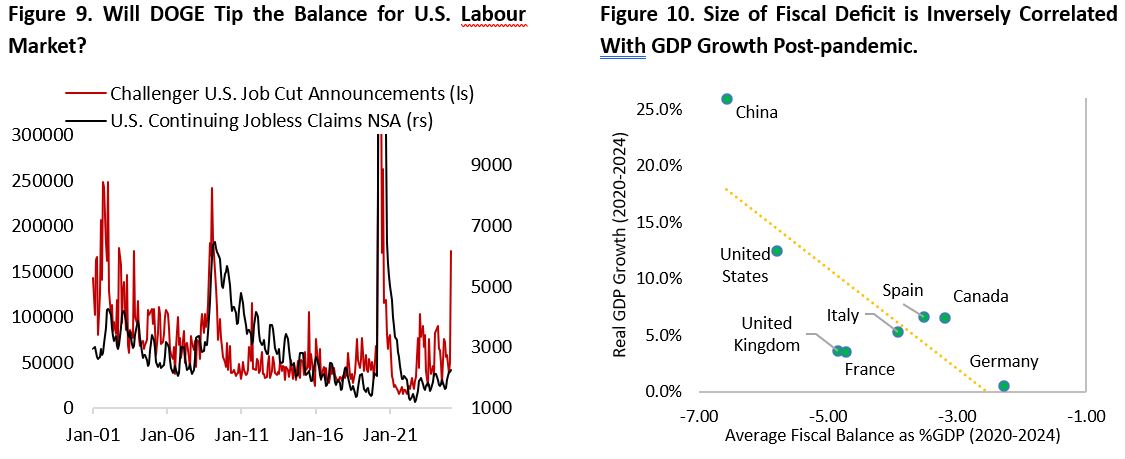
The public sector layoff done so far has started to show up in the hard data, with the federal government contributing 62,200 out of 172,000 job cuts in February – the highest monthly total since July 2020 (Figure 9). Given the government efforts to reevaluate and reduce spending on consultants, private sector employment could take a hit as well. The consulting group Accenture said that work for the US government, which accounted for about 8% of its revenue, slowed sharply under President Trump’s administration. This could tip the balance for the U.S. labour market given that government, education, and healthcare sector account for the majority of U.S. job gains over the past 18 months.
U.S. Treasury Secretary Scott Bessent’s comment makes retrenchment of fiscal spending a real possibility:
The bottom 50% of working Americans have gotten killed. We are trying to address that. We’re trying to get rates down and could we be seeing that this economy that we inherited [is] starting to roll a bit? Sure, and look, there’s going to be a natural adjustment as we move away from public spending to private spending. The market and the economy have just become hooked and we’ve become addicted to this government spending and there’s going to be a detox period.”
Meanwhile, policy could also be inflationary in the near term as multi-lateral trades are being replaced by bilateral agreements:
“Access to cheap goods is not the essence of the American dream…The American Dream is rooted in the concept that any citizen can achieve prosperity, upward mobility, and economic security. For too long, the designers of multilateral trade deals have lost sight of this…This system is not sustainable.”
Following the pandemic, we could see that countries with larger fiscal deficit saw faster growth (Figure 10). Among developed countries, the U.S. topped this list while Germany is on the opposite. For the reasons discussed so far, it’s not unthinkable that going forward the U.S. could see lower fiscal deficit and GDP growth, while German government stimulus increase its fiscal deficit and the country’s growth. In short, both countries’ policies are reversing.
For the reasons discussed above, we think the outlook for U.S. labour market is worsening quickly. Heightened policy uncertainty has translated to pause in hiring and capex investment for the private sector, and the U.S. government is now becoming a marginal drag to domestic demand. Figure 11 shows that historically deteriorating employment expectation could become a self-fulfilling prophecy. This would shake the last leg for low-income households, who already suffered from inflation in the past three years and push the odd for recession higher (Figure 12).

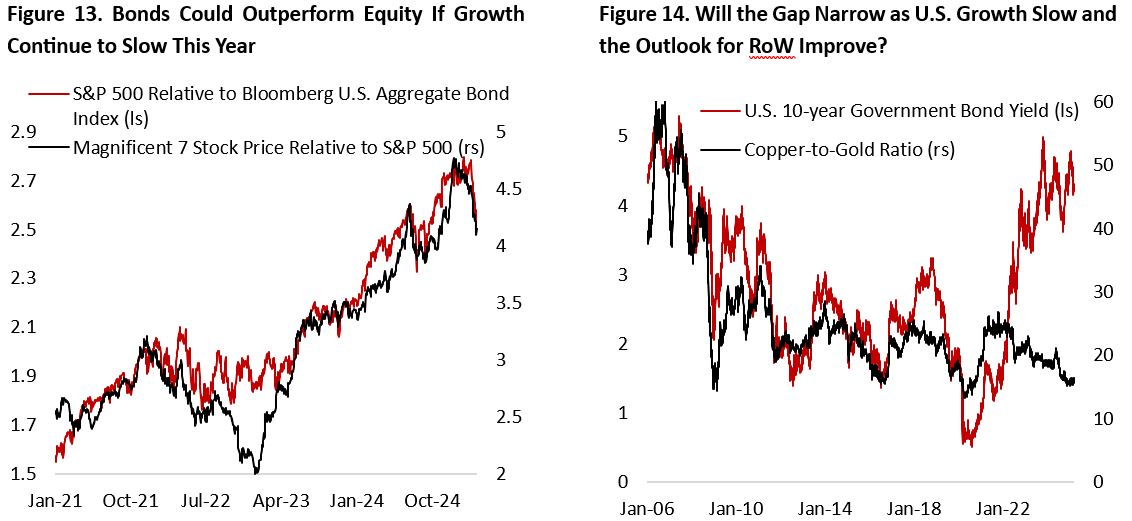
The investment implication of all these is straightforward. Potentially slower U.S. growth means we could see bonds outperforming equity this year, especially given the still elevated valuation of the latter and U.S. policy rate expectation currently remain above nominal GDP growth expectation (1.5% real + 2.0% inflation) at the end of this year (Figure 13). Chairman Powell bring back the word transitory to describe the one-off price adjustment due to tariff back in President Trump’s first administration and downplayed the spike in University of Michigan 1-year ahead inflation expectation. This reveals his worry on the economic and labour market outlook despite inflation still above the Fed’s 2% target, opening the room for the Fed to potentially cut policy rate more than current market pricing if employment data in the coming months indeed worsen. Our model continues to recommend overweighting U.S. 10-year treasury bond with fair value estimate of 2.6%.
From global perspective, long U.S. Treasury/Short German Bunds is still attractive if German government and other European countries follow through the execution of its proposals for boosting defense and infrastructure spending. Long U.S. Treasury/Short Japanese bond is also an alternative way to play the convergence theme amid diverging monetary policy trajectory of the two countries. Cross-asset, we look for the gap between U.S. 10-year yield and copper/gold ratio to narrow as U.S. economy slows while the rest of the world is staging a recovery (Figure 14). In this scenario, the greenback should resume its decline, even though we think the DXY index has an upside in the shorter term following sharp decline in March.
We also believe international stocks remains attractive as a hedge for long U.S. equity position, with MSCI EAFE sectors still trading at a deep discount relative to its U.S. counterpart following the recent rally (Figure 15, as of March 22, 2025). Potential fiscal tailwind and an upswing in European and Japanese business cycle bode well for their equity market and currencies. The historical median discount for international stocks is around 10-20%, which account for the lower return of capital, compared to 25-35% currently. Even though the outlook for European countries remains downbeat in the near term, global investors should not underweight the region given the elevated downside risk on U.S. equity amid concentration on momentum tech stocks and positive catalysts on the continent.

Lastly, the outlook for oil prices remains tilted to the downside amid uncertain demand outlook and OPEC+ saying that the group would proceed with a “gradual and flexible return” of 2.2 million bbl/d oil production over the next 18 months, starting in April. This is a surprise for the market as Saudi Arabia and seven other members of the Opec+ group had delayed the plan to bring production back online several times and was expected to do so again. Figure 16 shows that OPEC has an estimated 5 million bbl/d excess capacity today, which cap the upside potential for oil prices. The potential for lower oil and natural gas price could be a positive catalyst for growth, especially for European countries who have suffered from high energy prices amid the war in Ukraine. Looking ahead, we think WTI oil prices will trade sideways between $66-72/bbl. The good news is that pro-growth policies for the Chinese economy could translate to crude oil imports rising to pre-pandemic trend and push WTI price to the higher end of the trading range (Figure 17).

Copyright © 2025, Putamen Capital. All rights reserved.
The information, recommendations, analysis and research materials presented in this document are provided for information purposes only and should not be considered or used as an offer or solicitation to sell or buy financial securities or other financial instruments or products, nor to constitute any advice or recommendation with respect to such securities, financial instruments or products. The text, images and other materials contained or displayed on any Putamen Capital products, services, reports, emails or website are proprietary to Putamen Capital and should not be circulated without the expressed authorization of Putamen Capital. Any use of graphs, text or other material from this report by the recipient must acknowledge Putamen Capital as the source and requires advance authorization. Putamen Capital relies on a variety of data providers for economic and financial market information. The data used in this publication may have been obtained from a variety of sources including Bloomberg, Macrobond, CEIC, Choice, MSCI, BofA Merrill Lynch and JP Morgan. The data used, or referred to, in this report are judged to be reliable, but Putamen Capital cannot be held responsible for the accuracy of data used herein.
