Olaf Scholz, the current Chancellor of Germany, delivered his “Zeitenwende” speech on 27th February 2022, following Russian invasion of Ukraine three days earlier, describing the event as a historic turning point for the country and took the opportunity to announce EUR 100 billion fund for German military spending – reversing the country’s lackluster defense spending over the past decades. Three years following that speech, growth across developed European economies is stagnating, with secondary impact to the continent’s societal cohesion. Following Brexit in 2016 and populist parties taking greater role in Italian government coalition since 2018, pundits now expect the far-right movements to be the main contender for the establishment party with the potential of being in coalition government across the continent.
The parliamentary election in France last year and upcoming German election are two exhibit A to the rising popularity of far-right party across the developed world. In France, the Rassemblement National, the far-right party of Marine Le Pen, took 37% of the vote share in parliamentary election last July – more than double its vote share back in 2022. Meanwhile, one week prior to the Germany election, the Alternatif fur Deustchland party is polling at 21%, second only to the establishment (CDU/CSU) party at 29%. Given voters discontent across the developed world on issues surrounding inflation, economic opportunity, and immigration, it is perhaps not surprising that populist candidates offering a radical alternative solution look compelling. For many, the relative success of Javier Milei in reforming Argentine government and economy is a proof that a radical break from the establishment is what their economy needs.
Figure 1 shows that over the past five years following the pandemic, German economy has barely grown in real terms while France and British economy has grown at a rate of less than 1% annually. Compare this to the U.S., whose economy is 12% bigger and growing at more than 2% annually. As the chart shows, there is a loose but clear correlation between the size of government fiscal deficit and real GDP growth over the same period. This highlights the importance of government running fiscal deficit, either by raising spending or transfer to the private sector, to cushion the economy during periods of lackluster demand. Unfortunately, the Maastricht Treaty forces members of European Economic and Monetary Union to have a maximum of 3% of GDP fiscal deficit annually. Germany takes this to a further extreme by requiring balanced budgets in its constitution since 2009. This means barring extraordinary circumstances, German government is barred from taking on additional debts and limits Germany’s structural deficit to no more than 0.35% of GDP.

It is clear that the schwarz null (black zero, with regards to fiscal deficit) policy has hampered the German economic growth over the past decade and limit investments in crucial infrastructure of the economy. German train, once known for its punctuality, now arrives late almost 30% of the time. Following the departure of Angela Merkel, German government has been in a limbo in face of surging far-right movement and is poorly equipped to navigate a more hostile global environment. Today, with “America First” being U.S. foreign policy, European governments are increasingly accepting the fact that the union will have to stand on their own feet in terms of defense, trade relations, and boosting the continent’s growth. Fortunately, from macroeconomic perspective we are likely passed the point of maximum pressure for the European economy and the outlook for the continent should brighten going forward.
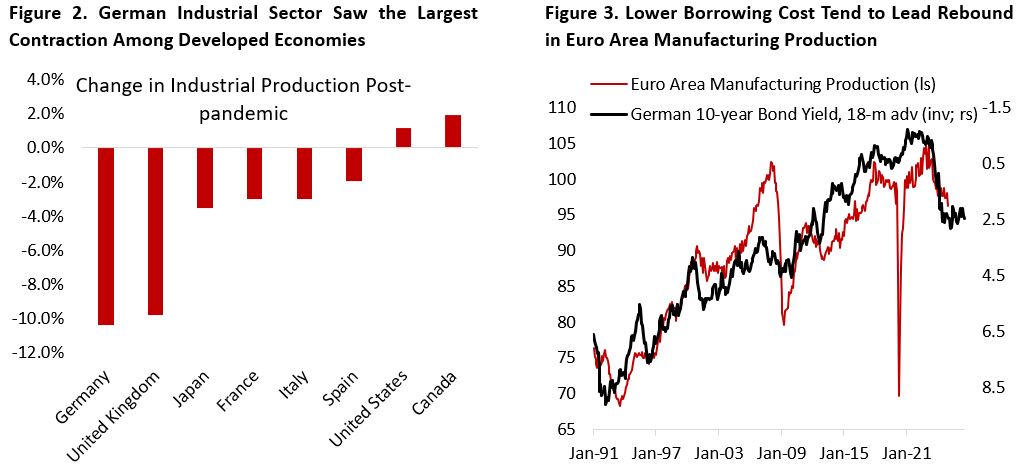
In hindsight, European countries have been facing three strong headwinds over the past three years: high interest rate, high energy prices due to the war in Ukraine, and weak global manufacturing activity. For Germany, the contraction in its industrial sector is particularly severe amid tight integration to cheap Russian gas supply in the decades prior, weak China’s import demand, and tighter competition from local Chinese firms in various industries including auto (Figure 2). Some companies in the chemicals and auto industries are unlikely to see a strong recovery as their competitive advantages were eroded by high cost and substitution from Chinese players translated to a permanent shift in the global industrial supply chain. But for the rest, the headwinds are now abating and could potentially become a tailwind in the coming year, despite the looming tariffs threat.
First, the ECB has cut policy rate by 160 bps since June 2024 and is expected to reduce it by another 75 bps by the end of this year. Figure 3 shows that historically, a lower borrowing cost led to an increase in Euro Area manufacturing production in the subsequent eighteen months.
Second, oil and energy prices have normalized and OPEC+ excess capacity is now estimated to be around 5 million bbl/d or equivalent to ~5% of global oil supply (Figure 4). Since last year, the group has postponed its plan to reverse its supply cut multiple times to prevent oil prices from dipping below $65 per barrel, highlighting the downside risk to oil price amid surging U.S. crude oil production.
In addition, President Trump’s policy for an end of the war in Middle East and Ukraine is forcing both sides – exhausted from years of war – to reconsider their position and make ceasefire a compelling option. Despite Russian economy being in a much better shape than expected by most economists at the beginning of the war, not everything is well: inflation is running at 9.5% y/y, labour supply is constrained amid the conscription for the army, and the rubble has been weak until recently. A lasting peace plan for Ukraine likely mean lower natural gas prices for the European market, a crucial input for German manufacturing center. Today, natural gas prices are still tripled the average prior to Russia invasion of Ukraine, which accounts for significant chunk of the rise in input cost for European manufacturing firms (Figure 5). For example, natural gas accounts for 70-80% of the energy used in producing fertilizers, whose price increase is passed through farmers and hence food prices. Moreover, German industries’ reliance on the supply of cheap Russian natural gas has left them in a less competitive position today in terms of cost advantage (Figure 6).

Lastly, we are seeing budding upswing in the global business cycle. The U.S. manufacturing sector was in expansion for the first time in January following 26 consecutive months of contraction (Figure 7), European manufacturing and construction PMI is ticking higher, and China’s economy is showing signs of stabilization. All these suggest improving outlook for the cycle-sensitive European economy.
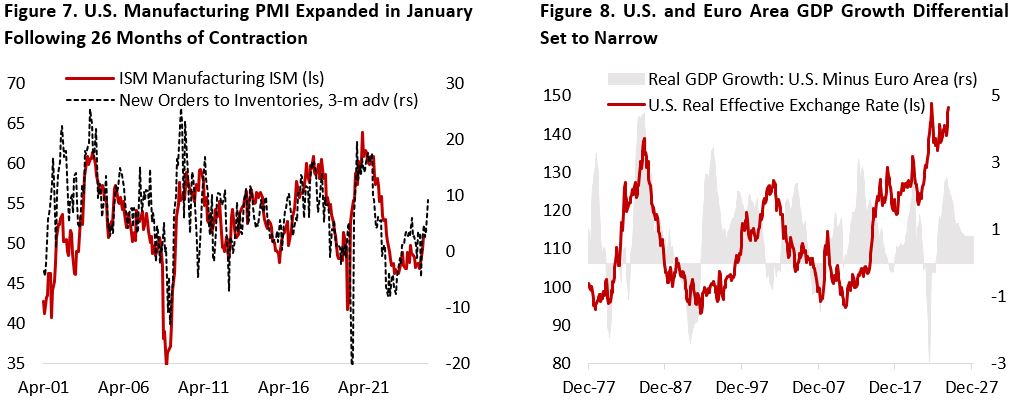
From an investment point of view, the improving outlook for global economy should bode well for stocks in the rest of world and negative for the U.S. dollar. So far this year, European equities have outperformed its American counterpart and major currency pairs are stronger against the dollar despite the threat of tariffs – suggesting investors are moving away from the “Trump Trade”. Today, the macroeconomic outlook is also supportive of a weaker greenback ahead. Figure 8 highlights real GDP growth differential between the U.S. and Euro Area is set to narrow, which tend to cap the dollar’s advance. The U.S. dollar’s valuation relative to its trade partners is also at an extremely expensive level and given the historical 7-to-10-year bull-bear cycle, we are skeptical of another leg up for the greenback.
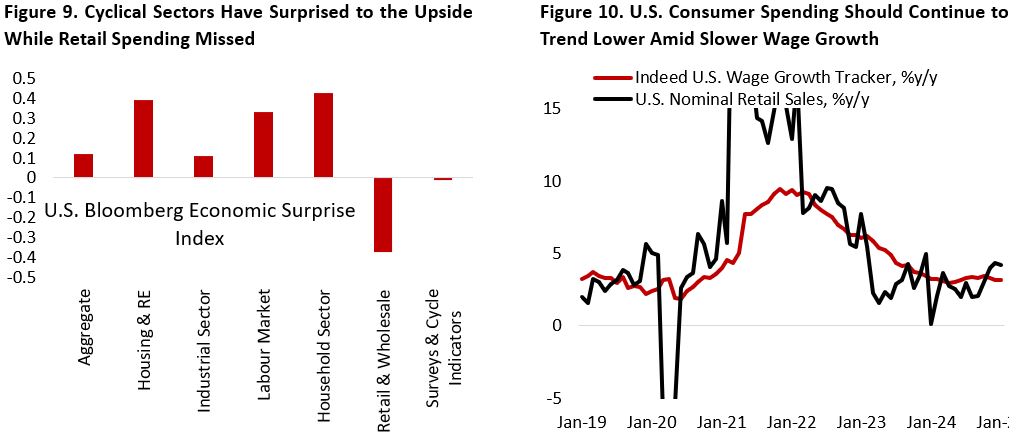
Focusing on the U.S. itself, expectations for its economy have risen significantly and the bar for a positive surprise is now higher. Despite our believe that the cyclical and rate-sensitive sectors of the economy will accelerate, we have held the view that consumer spending will continue to normalize this year on the back of slowing wage growth and looser but healthy labour market (Figure 9). This is consistent with the recent data release showing uptick in manufacturing PMI, decline in services PMI, weaker-than-expected retail sales, and still healthy job gains (Figure 10). In the coming years, however, immigration should slow materially from an average of 3 million between 2022-2024 to longer-term trend of 2-2.5 million or even lower under President Trump administration. This could translate to a drag for real GDP growth of around 0.3-0.6%.
The labour market development shows the U.S. economy has landed for the past year. Currently job openings are still trending lower and unemployment higher. But there is nothing alarming so far – layoffs remain low and companies are in low hiring, low firing mode. The question now is how fast we are going to move to the upper left quadrant in Figure 11 (higher unemployment, lower job vacancy). This is why the market is becoming increasingly sensitive to the downside surprise on jobs data. On the positive note, University of Michigan survey shows most households think the probability of them losing jobs in the next 5-year as quite low.
This could change amid the implementation of tariffs on goods imports, which will put upward price pressure for many consumer goods and potentially slow consumer spending, and hence economic growth. A lower purchasing power would also translate to a rising stress especially for consumers in the lower-income cohort, who contributed to a large part of the rise in auto and credit card delinquency (Figure 12).

From investment perspective, the high expectations on U.S. economy and corporate earnings growth have translated to investors crowding into U.S. assets and drove both the greenback and U.S. equities to a historically expensive valuation level (Figure 13). Brighter outlook for the rest of world and high expectations for the U.S. economy means the reward/risk ratio is now reversing.
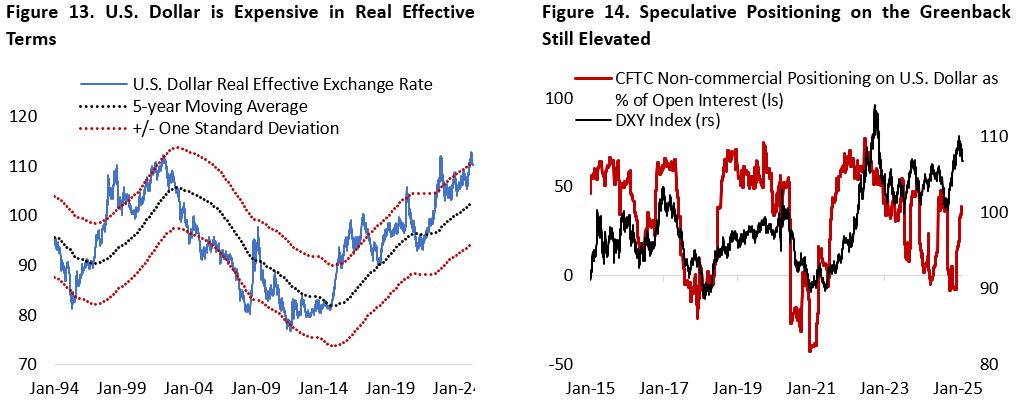
We believe the trade-weighted U.S. dollar will trend lower in the coming years. Speculative positioning on the greenback remains elevated, which historically marked the turning point for the dollar (Figure 14). On the equity side, the Mag-7 stocks’ negative reaction to their recent earnings release highlights that investors’ lofty expectations have been baked in the stock price.
This is also the reason we are more constructive on long-term bonds compared to the current sell-side consensus. Even if the U.S. macroeconomic backdrop remains healthy in the coming year, we are skeptical that the Fed will only cut policy rate once this year given the normalized labour market. First, Treasury Secretary Scott Bessent said that he wants to keep 10-year U.S. Treasury yield below 5%, which should be a ceiling to long-term yield and imply no rate hike by the Fed. Second, the current trend of weaker ISM Services PMI (read: slower consumer spending) and lower U.S. job openings ahead should be conducive environment for bonds. Lastly, we want to emphasize that long-term yield actually fell when President Trump’s threatened 25% tariff threat on Canada and Mexico, highlighting that market thinks the downside risk to U.S. growth is offsetting the inflationary impact from the announced tariff.

We aim to derive a fair value estimate for U.S. 10-year yield by regressing multiple variables to explain (R-squared 70%) the movement in 10-year yield since 1996. Figure 15 shows that currently U.S. 10-year yield is trading at two standard deviation above our fair value estimate (2.4%). Note that our fair value estimate had been moving higher much earlier than actual yield move post-pandemic.
Equity Strategy: Improving Cyclical Outlook and Tariffs Implication
Our view of a budding cyclical recovery in the U.S. and rest of the world means the outlook for cyclical sectors is improving, and we have been progressively increasing our cyclical exposure primarily through industrials and financials. Figure 15 plots the correlation and beta of each elevent GICS sector to the ISM manufacturing PMI, with the top right quadrant showing sectors that historically outperformed from the increase in the latter (Figure 16). Financials, materials, and industrials – all cyclical sectors – tend to benefit most. So far this year, these three sectors have outperformed the index (Figure 17).

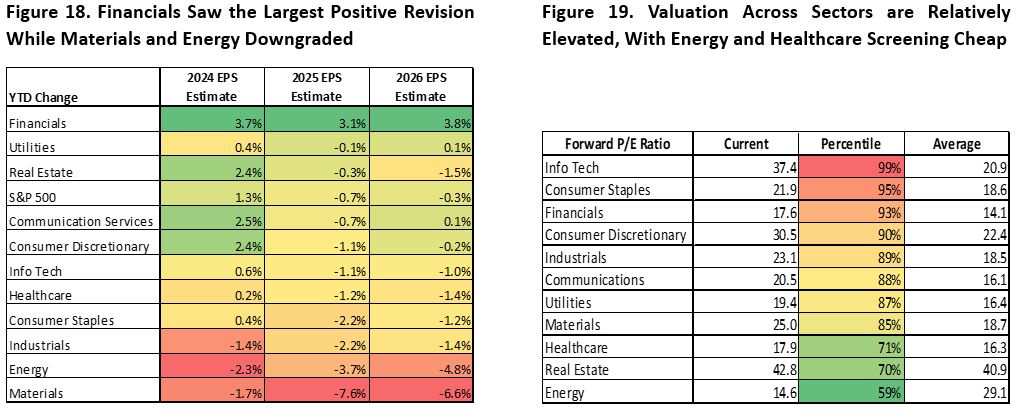
The outperformance of material sector is especially interesting given analysts have been revising estimate much lower for 2024 actual EPS, and 2025 and 2026 EPS estimate this year (Figure 18). The strength of copper and select commodity prices perhaps suggest the market is starting to price in recovery in the sector, which historically preceded pickup in global business cycle recovery. Meanwhile, consensus has turned bullish on financials on the expectation of lower capital requirement amid deregulation drive and acceleration in capital market activity with earnings expected to move higher in the coming years and valuation currently on the higher end of historical range (Figure 19).
Given the rising policy uncertainty, downside risk on growth and labour market, and the threats of tariffs, we are maintaining a quality tilt within our equity portfolio. On the cyclical end, we are overweigh both financials and industrials while keeping energy and materials close to neutral. Energy and materials tend to outperform during synchronized global growth recovery and we currently do not have a strong conviction that Chinese economy will stage a strong rebound, although there are signs that the worst of the growth slump in China’s economy is behind. For the energy sector, OPEC+ excess capacity and strong U.S. crude oil production capped the upside on oil prices, but the sector is cheap and has an attractive dividend and buyback yield.
On the defensive end, we are overweight healthcare and utilities while underweight real estate and consumer staples. The healthcare sector is the only sector that saw multiple contraction in 2024 and has gone through a two-year profit recession. Expectations for the sector is much more measured and the bar is low The decision to underweight staples is mainly on the valuation front, in which many names are becoming extremely expensive (for example, Walmart trades at 42 times earnings and Costco at 64 times). Following the pandemic, consumer staples firms have pushed for pricing power and enjoyed above-trend volume growth thanks to flushed consumers. This has been normalizing over the past two years and should continue to do so this year if the labour market weaken further, which is our base case. Meanwhile, we opt for utilities over real estate amid the tailwind of higher power demand from data center and reshoring.
On the growth end we continue to underweight both info tech and consumer discretionary, and hold a neutral position on communication services. Our underweight IT and discretionary – and hence Magnificent 7 stocks – was the main reason of the model’s underperformance in 2023 and 2024, but has been working so far this year. Valuation and earnings growth expectations continue to be elevated for both sectors, a combination that left them vulnerable to negative shocks.
We think that although the probability of broad-based tariffs on U.S. trade partners is low, tariffs are likely on goods deemed strategic and important for national security, including semiconductors, pharmaceuticals, and commodities such as steel, aluminum, and copper. The market is pricing this in with COMEX copper delivery in Chicago now trading at a 10% premium over the LME (London delivery) counterpart, which imply 40% probability of a 25% tariffs or 100% of a 10% tariffs.
Tariffs could be seen from three different angle. First, as a source of raising fiscal revenue and offset the potential extension of 2017 tax cuts. Second, to protect national security and bring manufacturing back to the U.S. Third, it could be seen as a negotiation tactic to force a concession from trade partners.
An escalation on the tariff front, including expanding the countries targeted by tariffs and higher rate, pose downside risk U.S. equity earnings estimates. For companies, the impact could be seen in the form of lower profit margin – if management choose to partially absorb the increase in cost – or lower sales volume should the increase in cost is passed to consumers. The 25% tariffs on Canada and Mexico and 10% additional tariffs on China is estimated to reduce S&P 500 earnings by around 3%, on top of the impact from tighter financial condition and change in consumer behaviour. Equity valuation should also derate amid investors asking for higher risk premium, which currently stands near the lowest in two decades.
For equity, the play could be to overweigh cyclical services (banks/financials) and UW cyclical goods (consumer, industrials). Services are less impacted by the threat of tariffs, whereas lower efficiency in the auto and industrial supply-chain could translate to an increase in cost. The impact of tariffs will likely be negative in the short-term: input prices should rise and new orders especially in the auto sector could take a hit. But we have seen inventory destocking in past two years and companies are rebuilding inventories again across industries, which should soften the blow. For the industrial sector, however, the longer-term impact could be positive as more firms could bring their production back to the U.S., especially those in the non-labor-intensive industries such as chipmaking.
The auto sector will suffer the most from the implementation of tariffs on U.S. and Mexico, as partially finished vehicles are often shipped back and forth multiple times across the border for assembly. This will translate to a higher auto price for the U.S. consumers, who are already facing higher average monthly auto payments due to more expensive financing cost. Auto manufacturers’ profit margins are also at risk as cost increases and sales volume declines. Last year, around 17% of vehicle sales in the U.S. is imported from Mexico and 6% from Canada – both of which is potentially facing 25% tariffs.
Figure 16 shows various sectors behave differently in face of rising global trade and economic policy uncertainty. All sector performance is negatively correlated to trade uncertainty such as tariffs, but energy and consumer staples tend to benefit from increase in economic policy uncertainty as investors seek for safety. Energy sector’s positive correlation to economic policy uncertainty is perhaps unsurprising given most geopolitical event in the past involves rising crude oil prices, including the war in Ukraine and Middle East. Taken together, real estate, consumer discretionary, and industrials tend to do worst during period of rising uncertainty.

As dicussed above, we are currently overweight industrials and underweight consumer discretionary, which on a net basis reduces the portfolio downside risk from tariff escalation compared to a passive benchmark. This is also in-line with our base case of an acceleration in cyclical sector activity and slower consumer spending (Figure 17). For a benchmark agnostic investor, a long industrial/short consumer discretionary sector could be the play for this year.
Copyright © 2025, Putamen Capital. All rights reserved.
The information, recommendations, analysis and research materials presented in this document are provided for information purposes only and should not be considered or used as an offer or solicitation to sell or buy financial securities or other financial instruments or products, nor to constitute any advice or recommendation with respect to such securities, financial instruments or products. The text, images and other materials contained or displayed on any Putamen Capital products, services, reports, emails or website are proprietary to Putamen Capital and should not be circulated without the expressed authorization of Putamen Capital. Any use of graphs, text or other material from this report by the recipient must acknowledge Putamen Capital as the source and requires advance authorization. Putamen Capital relies on a variety of data providers for economic and financial market information. The data used in this publication may have been obtained from a variety of sources including Bloomberg, Macrobond, CEIC, Choice, MSCI, BofA Merrill Lynch and JP Morgan. The data used, or referred to, in this report are judged to be reliable, but Putamen Capital cannot be held responsible for the accuracy of data used herein.
