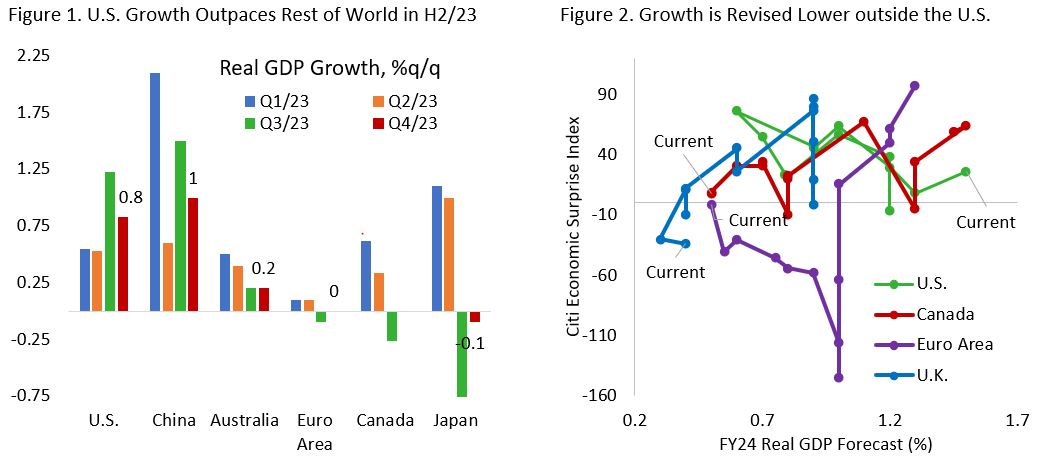
Exceptional U.S. growth continues to be seen in the last quarter of 2023 and beginning of this year, with Q4/23 reading shows the U.S. economy expanding 0.8% q/q (3.2% annualized), slightly higher than the 2% trend growth observed over the past two decades, while the rest of the world lagging. The Euro Area, Canada, and Japan all saw their economy contracting in the third quarter last year, and consensus is expecting growth in these regions to remain weak in Q4/23 (Figure 1).
Euro Area managed to avoid technical recession with Q4/23 GDP being flat after a slight contraction in the prior quarter as the region is still reeling from the impact of the war in its Eastern front and higher interest rate. Meanwhile, China, Europe’s second largest export market is in deflation amid lackluster consumer confidence, property sector crisis, and the reluctance of Beijing bailing out local governments. In Canada, strong immigration masked the ongoing recession on a per-capita basis that started few quarters ago. Figure 2 shows that the trajectory of real GDP forecast for this year and economic surprises have been lower in Europe, Canada, U.K., and other major countries, in contrast to the upgrades seen in the U.S.
Now, let us take a closer look at the driver of U.S. economic resilience based on recent releases of high-frequency data, which highlights the potential for a new upswing in the U.S. business cycle. First, the Atlanta Fed GDPNow forecast is pointing 2.8% q/q annualized GDP growth in the U.S. this quarter, following the downward revision amid lower-than-expected retail sales, still higher than economists’ forecast of 1.5% growth for the full year 2024 (Figure 3). Second, ISM Manufacturing and Services data have bottomed with businesses noting improvement in employment outlook (Figure 4). Third, employment growth remains healthy, at least on the surface, and is not yet pointing to an imminent deterioration in labour market. With consumers holding on their jobs and growth running above trend, recession is nowhere in sight, despite worrying signs of rising consumer credit delinquency rising to above pre-pandemic levels.

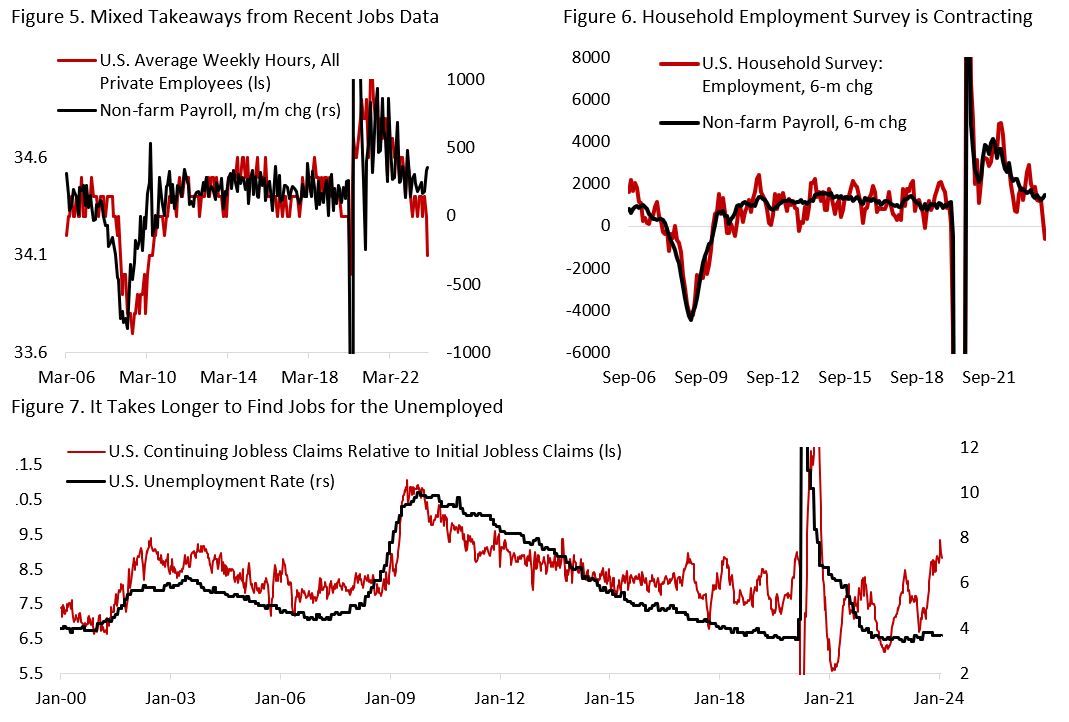
To be clear, we are not advocating investors to jump all in and take greater amount of risk, especially considering the relatively low risk premium currently in the market. Beneath the seemingly strong employment outlook, we are noting a wider divergence between the hard data released in January-February period. First, the average of weekly hours worked is declining sharply (Figure 5), which is not a sign of stronger labour demand. Second, households survey data shows the number of employed individuals has contracted for two consecutive months (Figure 6), in contrast to the tick higher in non-farm payrolls, which does not include self-employed individuals and may be driven higher by the increase in individuals taking multiple jobs. Third, the ratio of continuing jobless claims to initial jobless claims suggest that unemployed workers are finding it more difficult to find a new job (Figure 7), although currently the level of initial jobless claims is still relatively low. Given the recent wave of restructuring plan announced alongside Q4/23 earnings, however, we expect claims to increase this quarter.
Remain Long Bonds Despite U.S. Economic Resilience
In more recent weeks, there are talks that given the strong U.S. economic growth, the Fed does not need to cut policy rate this year. We thought this is based on a faulty logic. First, investors need to remember that the Fed’s dual mandate is to maintain price stability and full employment, and not necessarily to bring GDP growth lower – although this does help in bringing price stability in the case of demand-push inflation. On both fronts, the U.S. economy is making significant progress over the past eighteen months. Despite the upward surprise on January’s inflation data, the major driver was shelter inflation, in which leading indicators of actual rent is pointing to a sharp disinflation in the coming three quarters (Figure 8). In short, it does not derail our thesis of disinflation for the rest of 2024 amid supply-side improvement and slowing consumer demand. On top of this, goods deflation will likely continue as weaker Chinese export prices and slowing consumption in the rest of world weigh on prices (Figure 9). Anecdotally, Chinese e-commerce firms such as Temu and Shein saw their market share in North American rising, albeit still at a low level, by pushing down their prices aggressively as Chinese consumer demand remains weak.


To illustrate the potential size for a rate cut this year, we look at the Taylor rule, which was proposed in 1992 by American economist John B. Taylor for central banks to use in their effort to stabilize economic activity by appropriately setting short-term interest rates. Using the neutral rate estimate from Holston, Laubach, Williams Natural Rate of Interest, plus 5y/5y expected inflation, Figure 12 shows an estimate of the appropriate policy rate in the U.S. Given that real GDP growth in Q4/23 was at 3.3% q/q annualized and core PCE inflation currently at 2.9% y/y, above the historical 2% trend growth and inflation target in the U.S., Taylor rule suggests a policy rate of 4.75-5.00%, below the current policy rate of 5.5%. The slowing trend in growth and inflation, however, means that this estimate will likely fall. If the consensus estimate is correct that by the end of year U.S. real GDP growth will fall to 1.5% and core PCE inflation normalizing to 2.4%, holding neutral rate constant, Taylor rule is suggesting policy rate of 3.00-3.25%. Focusing just on the delta of suggested policy rate, this amounts to 175 bps decline in policy rate or seven 25bps rate cuts.

This, of course, is a flawed approach with its own criticism, as the neutral rate could only be estimated ex-post rather than ex-ante and these estimates are just that, but it highlights the risk of monetary condition being overly tight and increases the risk of financial accidents, on top of the ongoing concerns in commercial real estate sector and among regional banks with high exposure to the space. Note that historically, U.S. economy or financial market started to wobble following policy rate rising to above the suggested Taylor rule forecast, i.e., 2001 tech bubble burst, 2007 global financial crisis, 2019 repo market disruption. Given the levered financial system and tendency for monetary policy to tilt towards the looser end, Taylor rule estimate is perhaps more useful as a ceiling, rather than suggested, policy rate in the U.S.
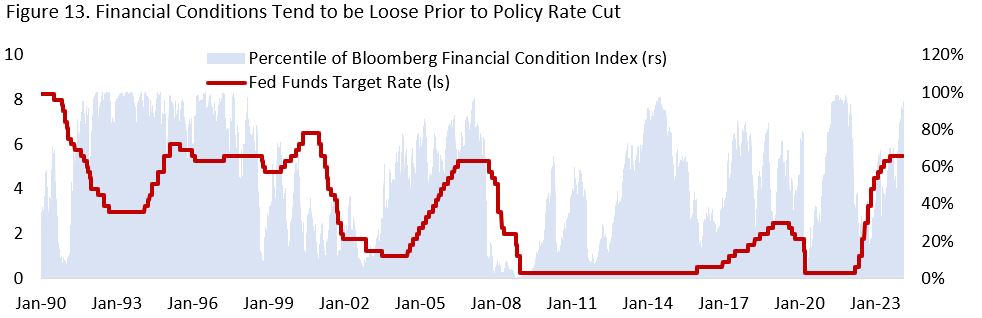
Many strategists are also pointing to a looser financial condition observed over the past five months as an argument that the current policy rate is not restrictive enough for the U.S. economy. But this misses the fact that looser financial conditions have historically coincided increase in Fed Funds rate (Figure 13), prior to it tightening abruptly as a result of financial accident, a burst of bubble, or growth slowing down materially as the lagged impact of monetary policy materializes 12-24 months following the increase in policy rate, as historically had been the case. In short, the longer the Fed holds interest rate at current level, the higher the risk to financial market, although the cushion for the U.S. economy is thicker this time, as discussed below.
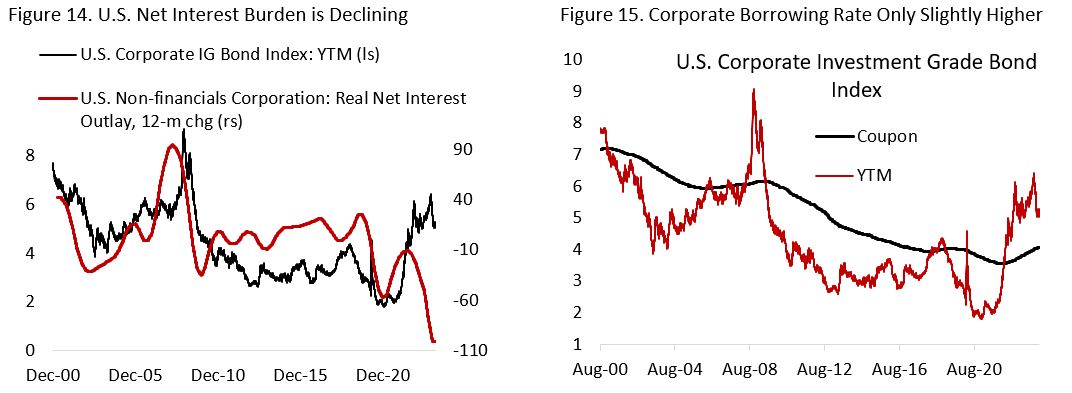
We are sympathetic to the view that in the current cycle monetary-policy impact has been relatively muted amid households and corporations already refinanced at record-low interest rates during the pandemic. Figure 14 shows that despite the 5.25-percentage-point hike in the fed funds target rate, and the increase in yield to maturity, the average coupon paid by mortgage and corporate borrowers have barely risen. In fact, the net interest paid by U.S. non-financial firms has been sharply declining, as a result of the low borrowing rate and high cash balances among U.S. corporations. As time goes by, U.S. non-financial corporations will eventually refinance their borrowing and face higher rates. But in the near term, the higher borrowing rate is not a meaningful headwind for their financial position (Figure 15).
On top of the impact from monetary policy, fiscal impulse is also playing a large role in the easing of financial conditions. The U.S. government is running a deficit worth 6% of GDP at a time when unemployment rate is near record-low level amid efforts to revive domestic manufacturing and rejuvenate the country’s aging infrastructures. In hindsight, the backdrop of a tight labour market, powerful fiscal stimulus and more muted impact from monetary tightening delays the historical time lag between monetary tightening cycle and its impact to the broader economy. Thanks to the hot labour market and excess savings, consumers were able to maintain their spending even as companies are hiking prices, with the traditional “higher prices lower volume” relationship only starting to show in recent quarter (e.g. Pepsi Co.). Meanwhile, companies are able to push prices aggressively two years in a row (2021-2022) and expand or hold their margin as wage growth only caught up a year later. It takes time to drain the excesses in U.S. consumer and corporate balance sheet into a more normal level, but we continue to see the path for softer consumer demand, labour market, and corporate profit growth this year.
Figure 16 shows the combination of U.S. fiscal and monetary policy impulse, alongside financial condition index (top) and U.S. real GDP growth (bottom). The direction of fiscal+monetary impulse tends to coincide with the changes in financial condition, and counter to GDP growth. This makes sense as policymakers tighten policies when the economy is running hot and stimulate it during periods of weak economic growth.

Looking at the top figure, the positive relationship between policy impulse and financial condition is very clear between 2001-2019. Following the pandemic, however, the relationship has been somewhat inconsistent, if not somewhat reversed. Policymakers’ overstimulation of the economy translates to a very loose financial condition, with financial condition only moderately tight even during the bottom of the equity market in October 2022. And despite the rate hikes since, financial conditions have actually loosened slightly. It will likely take negative fiscal impulse for financial condition to tighten significantly. Given the election year, however, the current U.S. government will want to prevent fiscal policy from becoming a significant drag on growth. This means we may see the combination of tight monetary policy and loose fiscal policy for longer, which could translate to further collateral damages for industries that are more sensitive to borrowing rate, such as banking and real estate.
Investment Implication
Our positioning this year is centered around the potential implication of tight (but not tighter) monetary and easy fiscal policy in the U.S. Historically, this has been a positive for the greenback, driven by stronger U.S. growth relative to the rest of world and from higher interest rate differential translating to inflow of U.S. assets. From asset allocation perspective, we continue to like bonds over equities as we continue to see downside risk for U.S. economic growth from slowing consumer spending and the labour market. The stock-to-bond ratio, alongside various leading indicators, is already pricing in a significant acceleration in growth, which may disappoint if corporate margin recovery fail to materialize and consumer spending pullback turned out to be sharper than consensus expectation (Figure 17). In Q4/23 earnings, more companies have been guiding lower top-line growth this year and restructuring their workforce. None of this is a surprise to us, almost two years following the first policy rate hike by the Fed.

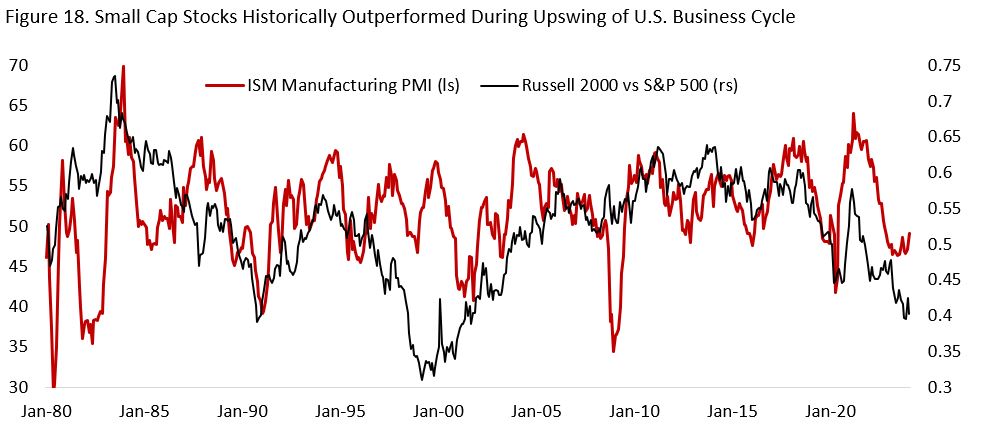
From an equity sector perspective, the strong fiscal incentive to revive U.S. manufacturing sector should support cyclical sectors, especially industrials. The risk/reward of going overweigh in small cap stocks is also becoming more appealing, as they historically outperformed during period of business cycle upswing and looser monetary policy, which may be in the card as soon as the next quarter (Figure 18). Remain underweight banks amid the potential unknown unknown risk from their exposure to commercial real estate and rising U.S. consumer credit delinquency.
On commodities, we remain underweight the sectors in equity portfolio amid disappointing Chinese economic recovery and inadequate policy stimulus announced so far. We reduced our energy allocation in the equity portfolio to neutral from overweight in January. U.S. crude oil producers continue to deliver record-high production despite rig count below pre-pandemic level, a sign of rising productivity in the sector. Meanwhile, Saudi Arabia has 3 Mbd spare capacity that could be turned online should the supply-demand balance tighten, with the overall OPEC+ spare capacity at 5 Mbd. Several EM countries are also planning for higher supply growth in the coming decade, including Brazil and Guyana. From demand perspective, slowing developed economies this year should weigh on traditional energy demand. Figure 19 shows that WTI oil prices could fall to US$60/bbl if disappointing global growth continues.

Copyright © 2024, Putamen Capital. All rights reserved.
The information, recommendations, analysis and research materials presented in this document are provided for information purposes only and should not be considered or used as an offer or solicitation to sell or buy financial securities or other financial instruments or products, nor to constitute any advice or recommendation with respect to such securities, financial instruments or products. The text, images and other materials contained or displayed on any Putamen Capital products, services, reports, emails or website are proprietary to Putamen Capital and should not be circulated without the expressed authorization of Putamen Capital. Any use of graphs, text or other material from this report by the recipient must acknowledge Putamen Capital as the source and requires advance authorization. Putamen Capital relies on a variety of data providers for economic and financial market information. The data used in this publication may have been obtained from a variety of sources including Bloomberg, Macrobond, CEIC, Choice, MSCI, BofA Merrill Lynch and JP Morgan. The data used, or referred to, in this report are judged to be reliable, but Putamen Capital cannot be held responsible for the accuracy of data used herein.
