
Two years ago, when inflation started to accelerate across the developed world and central banks were expected to hike policy rates, global macro strategists saw dark clouds on the horizon that the global economy will have to pass through. The last time inflation went out of control was in the late 1970’s, which coincided with aggressive monetary policy tightening by the Fed and a hard landing of the U.S. economy. With this on the back of their mind, investors proceeded cautiously and turned sour on both bond and equity market. That pessimism peaked in the Summer of 2022 and investor sentiment has improved markedly since, arguably to a euphoric level (Chart 1), as the U.S. economy turned out to be stronger than many had expected, and visibility has been gradually improving.

Similar to pilot with all his/her instruments, investors rely on every point of data release to gauge the direction ahead, the altitude of the business cycle and the direction winds are blowing. Chart 2 shows that the business cycle across developed economies is still on a descent, led by Europe and Canada, and potentially landing sometime this year, before taking off again. China, taking off much latter compared to the rest of world due to its prolonged zero-covid policy that ended in December 2022, is having trouble in gaining traction of its economic growth and maintaining altitude/stability of its domestic conditions.

Economists expect the U.S. economy to grow 1.2% this year, lower than the 2.4% real GDP growth in 2023. Canada is expected to grow only 0.5% – a step down from 1.1% last year – while Eurozone economic growth is forecasted to also expand 0.5%, similar to last year. Despite the lower growth outlook this year, however, there are reasons to be optimistic. After experiencing some turbulence over the past two years, including Russian invasion of Ukraine, U.S. regional banking crisis, and Israel-Hamas war, the U.S. economy remains in a relatively good shape:
- First, misery index – the sum of headline CPI inflation and unemployment rate – has fallen drastically over the past year while the U.S. economy has yet to show signs of recession (Chart 3). Such a drastic decline in misery index historically coincided with the U.S. economy exiting recessionary periods.
- Second, although financial conditions tightened in the second half of 2023, the Fed’s dovish pivot in December has pushed yields and the greenback much lower, blunting the impact of monetary policy tightening to the real economy (Chart 4).
- Third, U.S consumers are doing okay, at least for now. Jobs gains are decelerating to a historically normal level, job openings are falling as companies fulfill their labour demand, and unemployment rate remains below 4% (Chart 5). A healthy labour market is supporting consumer spending, the backbone of U.S. economy.

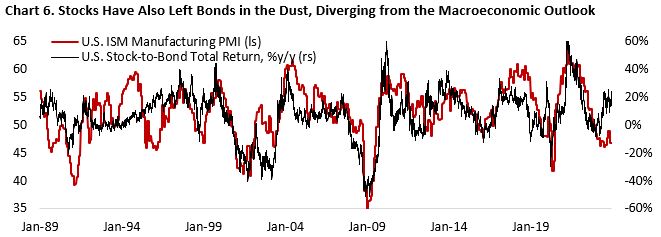
The risk of a policy mistake by the Fed has been reduced amid policymakers’ acknowledgement that monetary condition is tight, which should drive growth to below potential and inflation lower. However, the melt up in risk assets has been too far and too fast (Chart 5 and 6). It is akin to the passengers congratulating the pilot for a smooth landing when in fact the plane is still in the air. But the pilot him/herself is confident in delivering a soft landing. In December, the Federal Reserve’s Summary of Economic Projection downgraded its projection of inflation and GDP growth in 2024 and 2025, while forecasting unemployment rate to remain below 4.1% – an almost perfect landing.

As an investor, it pays to be an optimist. However, it is too early to unbuckle the seat belt and hope for the best outcome, especially after a sharp rally in equity prices and tightening in credit spread. We are seeing several risks on the horizon that could disrupt the soft-landing consensus among market participants and policymakers:
- First, history shows that it took 12-24 months for the changes in monetary policy to be transmitted to the broader economy. This means that at least half the impacts of policy rate tightening and quantitative tightening that began in March 2022 are still ahead of us. Our growth tax indicator – the average of the U.S. dollar index, 10-year government yield, and oil price, all standardize – continues to point to a growth headwind in the coming year, which could keep new upswing in U.S. business cycle at bay (Chart 7). This is also consistent with the fifteen consecutive months of contraction in U.S. leading economic indicator (Chart 8).

- Second, the fiscal boost that has been supporting growth this year will become a drag in 2024. Chart 9 shows that on an annual basis the U.S. government has been a positive contributor to spending in the economy in 2023, reversing the drag during 2022 – when growth scare was rising, and risk assets corrected. Although the election year tend to coincide with largesse in fiscal spending, the current Republican control of the Senate will likely reign in the additional spending that could be done by the White House.

- Third, in a multipolar world, geopolitical considerations will increasingly disrupt the flow of trade and investment between economies, altering the profile of various investment opportunities previously thought as attractive. For instance, Russian assets are now deemed as not investable by most investors while foreign direct investment to China has turned negative in 2023 amid Beijing’s unfavourable policies toward private enterprises and its economic malaise. Meanwhile, the supply-chain impacts of war to commodity market, mostly through agriculture and energy prices, will affect the policies taken by global central banks. It is difficult to estimate the exact magnitude of the price impact of oil supply disruption, but an Iranian oil export curb amounting to half of its production could translate to oil prices being between 20-50% higher (Chart 10). With the Russia-Ukraine and Israel-Hamas war still ongoing, rising geopolitical uncertainty could increase market’s risk premium from currently tight levels.

- Fourth, the fact that consumer spending and labour market are still relatively in good shape today does not mean it will continue to do so throughout the year – something that the equity and credit market seems to be betting on. Jobs demand – the sum of non-farm payrolls and job vacancy – has peaked and will likely continue to fall as GDP growth decelerates. Chart 11 shows that most of the jobs gain in recent quarters has been dominated by the public sector and industries with known structural imbalance, such as education and health services. The aggregate non-farm payroll itself has fallen to a historical average level in H2/23 and survey data highlight a step down in future labour demand (Chart 12).

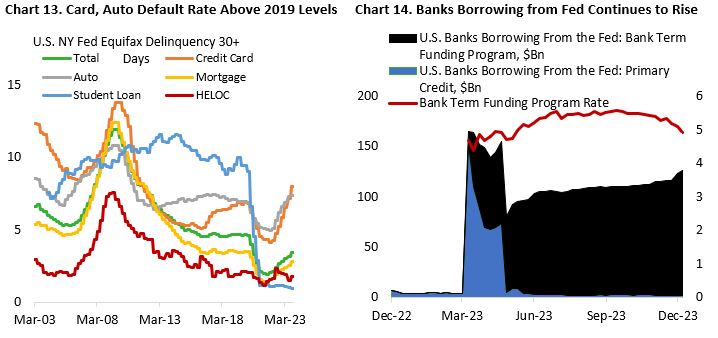
- Fifth, delinquencies for auto and credit card have risen to above pre-pandemic levels despite a healthy labour market, although mortgage default rate remains low amid most households in the U.S. (not in Canada) locking rate at low level for their remaining mortgage term. The current trajectory of rising credit default rate and looser labour market bode poorly for the average consumers’ financial condition.
- Lastly, some risks derived from a known unknown and unknown unknown. The U.S. regional banking crisis has not been fully resolved as smaller banks are having difficulty to compete for deposits. Chart 14 shows that banks borrowing from the Fed is still rising despite the average regional banks’ stock price rebounding of late. With quantitative tightening running on the background, tighter liquidity could trigger an unpleasant surprise somewhere in the corner of financial market.
What do these all mean for portfolio strategy?
If we (and the consensus) are right that the U.S. and global economy will see lower growth and inflation this year, bonds are – and have been in the past quarters – an attractive asset to hold in a balanced portfolio (Chart 15). On top of its diversification benefit through negative correlation with equities and other risk assets, yields are now much higher than over the past decade. This contrasts with equities, which has seen significant compression in risk premium.

The case for being overweight bonds is even stronger when we consider the macroeconomic backdrop. Following a better-than-expected growth throughout the first half of 2023, economic surprise index has been rolling over since. Prints for jobs and economic growth data have been revised lower in Q3 and Q4, which is a continuation of the trend in the first half of 2023. A continuation of the downward trend in economic surprise should be a tailwind for bonds while being a headwind for stocks. In sum, lower growth this year should translate to lower bond yields and lower equity earnings growth. With six 25-bps policy rate cut in the U.S. currently priced in by the bond market, the former has become the consensus view (Chart 16), but not the later (Chart 17).

As historically has been the case, in the current cycle the U.S. economy is also exhibiting a stronger performance compared to other developed economies. Several European economies are already in recession, with Germany particularly in a very weak spot due to the weak demand of its manufacturing sector that is closely tied to Chinese economic outlook and hit hard by the higher energy prices amid Ukraine-Russia war. Meanwhile, Canadian economy is potentially already or about to enter recession (Chart 18). Unlike the long-term fixed mortgage structure in the U.S., Canadian mortgage borrowing is fixed for only few years term, which means faster transmission of tighter monetary policy to consumer spending (Chart 19). Moreover, the more cyclical structure of Canadian economy vs the U.S. means higher growth volatility. Compared to its southern neighbor, the higher downside risk for Canadian economy should bode well for Canadian bonds but not its equities.

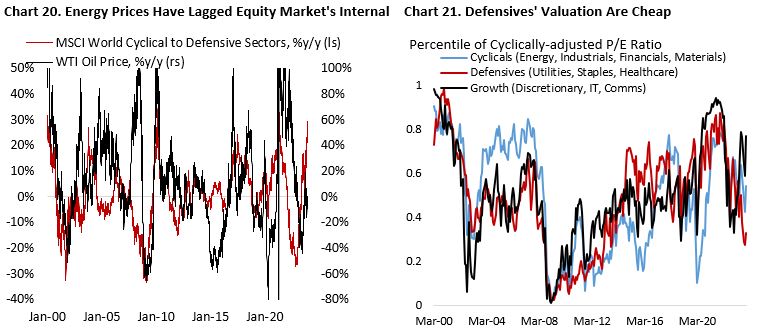
Within the global equity space itself, pockets of opportunities remain. For example, in the case of soft landing, energy prices will likely catch up to the upward moves in cyclical stocks relative to defensives (Chart 20). Such scenario bodes well for oil & gas producers that will benefit from the recovery in traditional energy demand. In the case of a hard landing, however, defensive sectors should outperform. After being out-of-favor for the past 18 months, these sectors could again shine. Currently, valuation for defensives screen cheap, contrary to those in growth sectors that had been bid for most of 2023 (Chart 21).
Outlook on U.S. Equities: Slowing Top-line Growth Amidst Margin Expansion
Against the bearish consensus view in the beginning of 2023, global stock markets closed the year significantly higher with U.S. equities outperforming the rest of world. The S&P 500 index gained roughly 25%, higher than international equities (MSCI EAFE) at 15% and Emerging Market equities (MSCI Emerging Market) at mid-single-digit positive return.
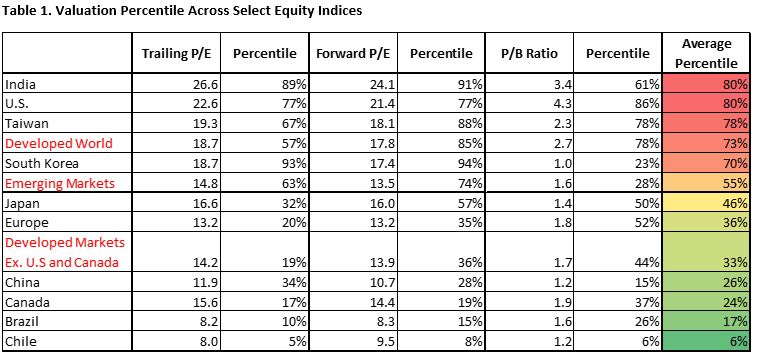
The driver of these returns, however, varies widely (Table 1). For the U.S. equity index, all the gain could be attributed to multiple expansion, with the forward P/E ratio of S&P 500 index rising from 17.6x at the beginning of 2023 to slightly above 20x at the end of year. Clearly, investors are expecting rapid earnings growth in 2024 following lackluster earnings growth in 2023. International stocks also saw valuation expansion from 13.0x to 14.4x forward earnings, alongside low single-digit earnings growth. Meanwhile, Emerging Market equities went through an earnings recession amid disappointing Chinese economic recovery and the fact that many developing countries’ central banks had tightened monetary policy one year early compared to the Federal Reserve and European Central Bank.

This year, U.S. real GDP growth and inflation are expected to slow to 1.2% and 2.6%, respectively, which should translate to a lower top-line growth for the aggregate U.S. equities compared to in 2023 (Chart 1). As a comparison, U.S. economy grew 2.4% in 2023 while inflation was at 4.1%. The good news is that slower, but positive, revenue growth for U.S. stocks will likely coincide with profit margin expansion, boosting the outlook for U.S. stocks.
Profit margin for the aggregate U.S. stock index has fallen in 2023 amid deceleration in top-line growth, lingering cost pressure from supply-chain disruption, and softer but elevated wage demand. However, given the falling material prices and better cost discipline, the outlook for profit margin has markedly improved. Chart 2 shows that the gap between CPI and PPI inflation, a proxy of what company could charge for its final product minus its input cost, points to a margin expansion in the coming one and half year.

Given the elevated U.S. equity multiple (20x FY24 earnings), the room for multiple expansion this year is limited. This means U.S. stocks performance this year will be more reliant on earnings growth. Consensus estimate for FY24 EPS is currently at $243, implying a 10% growth compared to FY23. Taking this earning forecast and applying a 16 to 20 times forward earnings multiple give us a range of 3900 to 4860 for the S&P 500.
From positioning perspective, investors begin 2024 with a bullish view. Positioning among asset managers and leveraged funds is above the historical average level, while retail investors’ net positioning is at an extreme bullish level since the pandemic began. The bullish setup is contrary to in the beginning of last year when recession in the U.S. was a consensus view. History shows, however, that it is too early to be “all-in” and take an aggressive stance on equities given that bulk of the lagged impact of monetary policy tightening is still ahead (Chart 3).

Within equity, we like overlooked and beaten-down defensive stocks in the consumer staples, healthcare, and utility space due to their attractive valuation profile and defensive characteristics. These sectors’ performances have significantly lagged their growth counterparts as the narrative swing from recession to soft landing throughout 2023. Meanwhile, the risk/reward of chasing growth stocks have significantly deteriorated following the sharp rally last year that translated to these stocks trading at an elevated multiples amid the potential for rising equity volatility this year.

International and Emerging Market Equities
U.S. stocks outperformed the rest of world in 2023 (Chart 1), with the S&P 500 index gained roughly 25%, significantly above international equities (MSCI EAFE) at 15% and Emerging Market equities (MSCI Emerging Market) at mid-single-digit positive return. Valuation for global equity indices rose throughout the year, with the forward earnings multiple for S&P 500, MSCI EAFE, and MSCI EM expanding 26%, 11%, and 22%, respectively, compared to the beginning of the year.

Across all metrics, valuation for the S&P 500 remains elevated amid the large contribution from high-growth, large-cap names in the technology space (Table 1). More bullish investors would correctly point to the domination of the global internet advertising space by Google and Meta, e-commerce by Amazon, and Cloud by Microsoft and Google, smartphone by Apple – all of which drive higher earnings growth and may justify premium valuation for these firms. However, the case for diversification into international and EM equities is stronger than ever, especially as valuation for U.S. growth stocks become very stretched.
Given the disproportionately large U.S. equity representation in global equity indices, the decision to be over/underweight U.S. stocks could make a material difference to investors’ portfolio return. In the long run, the bulk of equity returns is driven by its underlying earnings growth, and portfolio manager’s job is to allocate capital to companies that could deliver above-average earnings growth without overpaying (valuation).
In the coming quarters, the expected deceleration in global growth bodes poorly for equity earnings growth. Last year, international stocks saw earnings grew only 3.2% during the year, while EM stocks experienced an eye-watering 16% decline in earnings amid disappointing Chinese economic recovery and the fact that many developing countries’ central banks had tightened monetary policy by almost full year earlier compared to the Federal Reserve and European Central Bank.
On the positive note, the dramatic correction in earnings across developing countries could mean their economy will also be first-in, first-out in their respective business cycle. If recession in the developed world is avoided, EM equities could see faster earnings growth relative to their U.S. counterparts. The case for valuation expansion also remains, as EM central banks have started to cut their policy rate over the past six months (Chart 2), whereas the Fed and ECB are forecasted to cut policy rate only by the end of this quarter. The bottom line is that international and EM equities’ valuation are cheap and could be re-rated as central banks across the world shift towards looser monetary policy this year.

Copyright © 2023, Putamen Capital. All rights reserved.
The information, recommendations, analysis and research materials presented in this document are provided for information purposes only and should not be considered or used as an offer or solicitation to sell or buy financial securities or other financial instruments or products, nor to constitute any advice or recommendation with respect to such securities, financial instruments or products. The text, images and other materials contained or displayed on any Putamen Capital products, services, reports, emails or website are proprietary to Putamen Capital and should not be circulated without the expressed authorization of Putamen Capital. Any use of graphs, text or other material from this report by the recipient must acknowledge Putamen Capital as the source and requires advance authorization. Putamen Capital relies on a variety of data providers for economic and financial market information. The data used in this publication may have been obtained from a variety of sources including Bloomberg, Macrobond, CEIC, Choice, MSCI, BofA Merrill Lynch and JP Morgan. The data used, or referred to, in this report are judged to be reliable, but Putamen Capital cannot be held responsible for the accuracy of data used herein.
