In June Bank of Canada unexpectedly raise its policy rate by 25 bps, defying the expectations that Canadian policymakers are done with their rate-hiking campaign. Investors learned that after a well-telegraphed “pause” central banks could again tighten the screw. Yields across the developed world surged following the BoC’s decision. Meanwhile, in the U.S. Fed Chairman Powell is criticized for its decision to not increase policy rate in June while still expecting another 50-bps worth of rate hike in the second half of the year. In sum, global central banks continue to pound the table with rate hikes, despite the progress on inflation and the labor market, albeit at a slower-than-expected pace. Given that monetary policy works with a “long and variable lag”, is it possible that global central banks have again overtightened? After all, the Fed only started to raise interest rates 16 months ago and the full impact of tighter policy have yet to be fully felt.
Earlier this year it was thought that U.S. and Europe will be able to skirt recession this year amid diminishing shock from high energy prices. But final reading on Q1/23 GDP numbers shows that Europe, New Zealand, and several other developed countries have recorded a technical recession – two consecutive quarters of negative %q/q GDP growth. Unlike in previous recessions where fiscal and monetary policy turned easier, however, both are currently expected to be even tighter. The Fed is expected to raise rate by at least another 25 bps whereas ECB is priced in for another 50-bps worth of interest rate hike until the end of the year. Similar steps are expected from other global central banks (Bank of England +125 bps, Australia +50 bps, and Canada +25 bps). Only New Zealand is forecasted to have done with its hiking cycle at the time of writing. We continue to think that recession in the U.S. has been postponed, rather than canceled, due to the abundant excess savings buffer resulting from generous fiscal stimulus in 2020/21, which dwarfed the size of stimulus in European countries.
The other argument, however, focus on the fact that although global manufacturing cycle has significantly softened, the risk of a stickier inflation amid tight labor market means policymakers would be better off tilting the balance to overtightening monetary policy rather than risking failure to bring inflation back to their target. In addition, the outlook for the housing sector has improved too with prices again on the rise and sales and homebuilding activities accelerating, despite mortgage rates staying elevated.
For the past year we have been (wrongly) on a defensive footing amid the expectation of economic and earnings recession in the U.S. and downturn in global cycle (Chart 1). Manufacturing activities have indeed fell into deep contraction and earnings growth is currently negative on a year-on-year basis, but the strength of consumer spending and plenty of liquidity have supported the economy and stock prices so far this year. We still think recession is likely this year and the risk to U.S. equity is to the downside, but a bottom in manufacturing activity could also happen sometimes in H2/23.

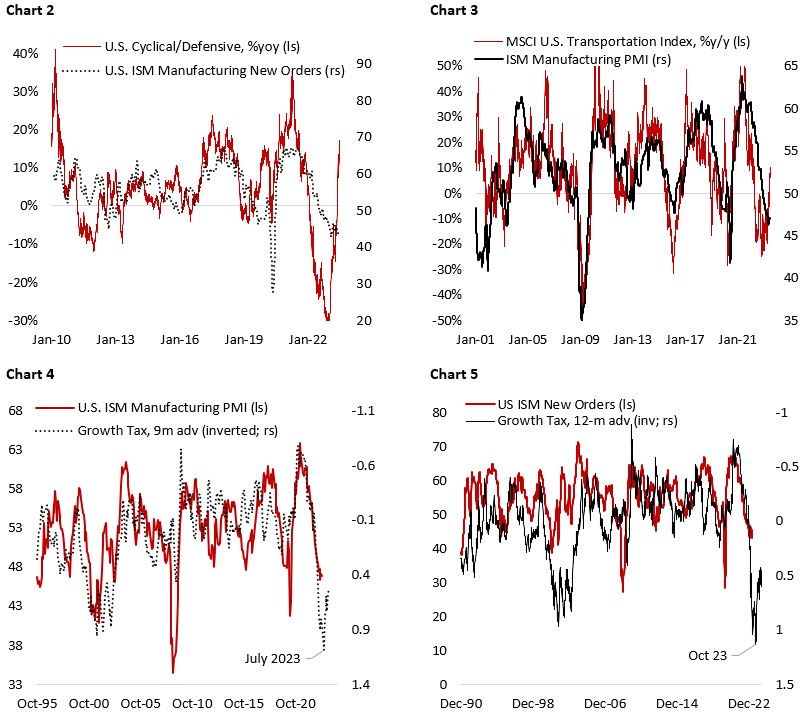
First, the performance of cyclical/defensive stocks have historically been a decent predictor of the fluctuation in the manufacturing cycle, and the sharp upturn in this ratio of late is pricing in a V-shaped rebound in ISM manufacturing new orders (Chart 2). This is similarly confirmed by the performance of the U.S. transportation sector index (Chart 3).
Second, our growth tax indicator – the average of the dollar, oil price, and 10-year yield, all standardized – has been pointing to a potential bottom between July and October 2023, although it is not expecting as much of a rebound into expansion territory, unlike those implied by the equity sector performances (Chart 4 and 5).
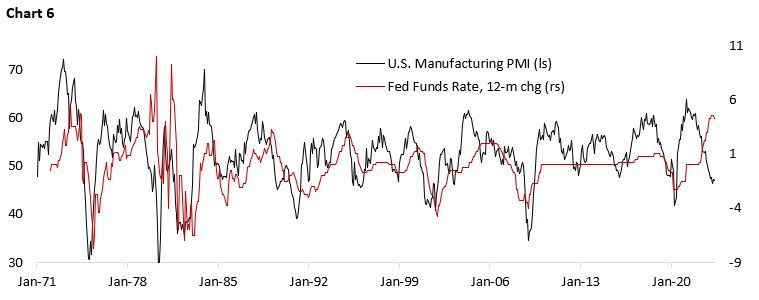
Over the past four decades, the changes in U.S. monetary policy tend to track the manufacturing cycle fluctuation in lockstep, with the Fed raising interest rates when growth accelerates and cutting it during downturns. The only exception was in 1978-80 when inflation was soaring to double-digit amid oil shock related to the Iranian revolution. Interestingly, the inflation problem we have in the current cycle also followed an oil shock related to Russia’s invasion of Ukraine, which was worsen by a too loose fiscal and monetary policy during the post-covid recovery – amplifying the boom in economic growth over the past three years. In other words, unlike in a normal cycle when the Fed historically raise (cuts) rate in the face of manufacturing sector and growth upturn (downturn), in this cycle monetary policy is being pro-cyclical (Chart 6). This should translate to a mounting headwind for global goods demand and hence a weaker rebound in manufacturing sector activities. The pro-cyclical monetary policy post-covid period should also mean greater swing of boom-bust in the current cycle, with the U.S. economy currently cooling from a very hot macro environment.
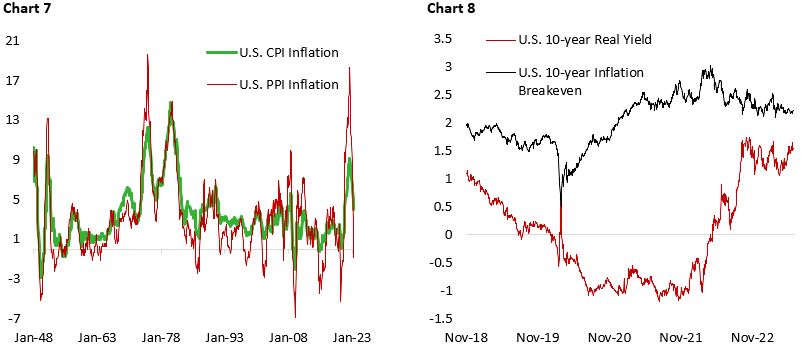
Our concern on lackluster global demand is supported by the weak commodity prices and inflation breakeven moving lower. Despite rounds of supply cut by OPEC+ members oil prices are trading at only $70/bbl, highlighting lackluster global demand for energy, while the economic recovery in China has yet to drive base metal prices higher. Low commodity prices are good news for the fight against inflation, but the risk is that policymakers’ overdrive to continue to tighten monetary condition may result in a deflationary slump next year, especially considering that producer price index (PPI) in many countries have fallen outright into deflation. Chart 7 shows that historically it did not take long for consumer price index (CPI) inflation to fall alongside producer prices.
The renewed aggressiveness of policymakers is also suspect given inflation expectations and breakeven rate continue to trend lower. Over the past quarter, the tick higher in long-term yields have been driven by higher real rates while inflation breakeven slightly fell (Chart 8). We suspect that policymakers are simply talking tough and may not back it up with actual rate hikes in the second half of the year. An overly tight monetary policy will eventually push the economy into recession and translate to a renewed weakness in energy and metal prices.
The most important development of late, however, is arguably on the labor market front where jobless claims are finally on the rise. This is consistent with the historical 12 to 18-month lag between the timing of the Fed’s initial rate hike and weaker employment picture (Chart 9). A faster hikes and higher terminal policy rate in the current cycle increase the chance of a sudden stop, which makes the weekly jobless claims data important to scrutinize. Chart 10 highlights the high likelihood for unemployment rate to increase closer to 5% in the coming quarters, which would fit the forecast of a roughly 2% increase in unemployment rate resulting from tighter lending standards (Chart 11). On the positive note, the currently still elevated job openings should provide some support to the labor market outlook in the next few months.
Chart 9

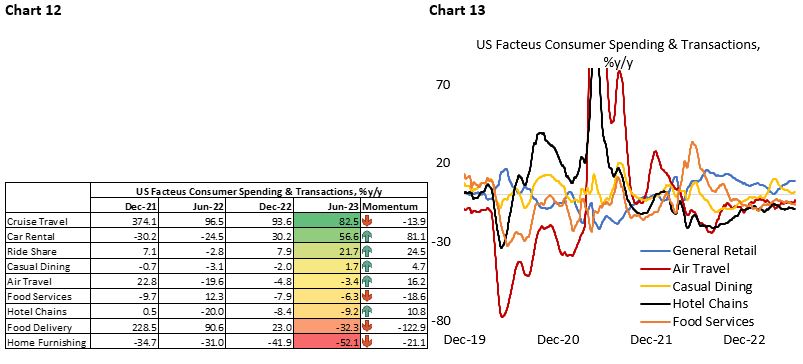
A weaker labor market outlook is worrisome, as the lower and middle-income segment of consumers that often suffer the most during layoff season are already struggling to service their debt. Currently, default rates for auto and credit card loans are already higher than pre-pandemic level, at a time when the labor market could be described as very tight. Meanwhile, the end of student debt moratorium in August will add to the consumer debt burden in the U.S. The boom in discretionary spending among higher-income consumers are also starting to slow. Spending on air travel, food services, and hotel chains are lower than the same period of last year (Chart 12 and 13).
The bottom line is that we should continue to see both headline and core inflation trending lower in the coming months, supported by lower housing price inflation that has started to show up in the official CPI data. And after a much stronger-than-expected tightness in the labor market and robust consumer spending in the first half, downside risks for these two intertwined variables will only grow in the second half, likely weighing on risk asset performances.
U.S. Equity: Positioning and Sentiment Have Reversed from Fear Back to Greed
Last October when the S&P 500 was trading at 3600 sentiments among investors was at rock bottom and investors were net short equity futures at record amount (Chart 14). In short, everybody was bearish, and most were expecting recession to hit global economy sooner than later. The surprising resilience of U.S. economy and lack of marginal sellers in the market mean the bar was low for stock prices to stage a rebound. This, indeed, is what happened over the past eight months.

But make no mistake. Despite the better-than-expected Q1/23 earnings season, actual earnings and earnings growth has fallen. With the U.S. stock market having risen more than 20% from its October 2022 low, the S&P 500 is now back trading at 20.1 x forward earnings. The surprise to us is that the multiple expansion happened at a time when U.S. Treasury yields remained elevated, which translate to further compression in equity risk premium (ERP) – currently at 1.18%, a 15-year low. Chart 15 shows that the fluctuation in ERP could be explained by the changes in real policy rate as measured by the Fed Funds Target Rate minus U.S. CPI inflation. A move towards positive real rate historically coincides with a healthy growth outlook and strong market performance, hence lower ERP, which we have seen during the post-covid recovery period. A higher real rate, however, also acts as a headwind to growth. The chart shows that historically ERP did not necessarily fall in lockstep even as real rate turned further into positive territory as the economy normally has weakened materially and forced the Fed to ease policy. Given the macro-outlook we outlined above, we expect deteriorating liquidity to push ERP higher in H2/23. Ongoing quantitative tightening should continue to drive Fed’s balance sheet lower while build up in Treasury General Account should hasten the reduction in banks’ reserves, both acting as a drain in liquidity (Chart 16). After all, without an actual improvement in earnings, valuation for U.S. equity is currently very stretched – driven by the mega-cap tech stocks that account for quarter of the index.

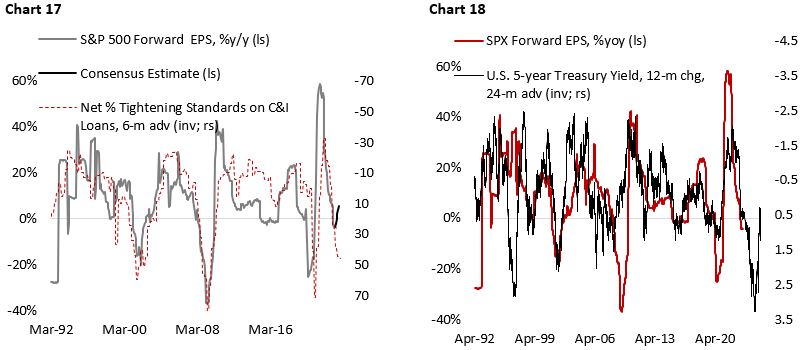
Chart 17 and Chart 18 suggest that the correction in earnings for U.S. stocks is not yet over, with tightening lending standards predicting an almost 20% decline in S&P 500 forward earnings, based on historical correlation. In contrast, market consensus is expecting a positive, single-digit earnings growth in the coming quarters. This is unlikely to happen if we are correct that the outlook for U.S. labor market will deteriorate and growth in service spending continuing to trend lower. The upside risk to earnings could come from the potential bottom in manufacturing cycle in Q3/23. But historically this should translate to tailwind for earnings only in the subsequent quarter.
With valuation rising back to the top of historical range and the U.S. macro environment likely to deteriorate further, we remain defensive in our asset allocation with higher-than-normal allocation to cash, overweight position on staples and healthcare, and underweight industrials and discretionary names. Info tech sector has also become increasingly overbought and expensive following the recent rally and we are looking to reduce our allocation to the sector.
Copyright © 2023, Putamen Capital. All rights reserved.
The information, recommendations, analysis and research materials presented in this document are provided for information purposes only and should not be considered or used as an offer or solicitation to sell or buy financial securities or other financial instruments or products, nor to constitute any advice or recommendation with respect to such securities, financial instruments or products. The text, images and other materials contained or displayed on any Putamen Capital products, services, reports, emails or website are proprietary to Putamen Capital and should not be circulated without the expressed authorization of Putamen Capital. Any use of graphs, text or other material from this report by the recipient must acknowledge Putamen Capital as the source and requires advance authorization. Putamen Capital relies on a variety of data providers for economic and financial market information. The data used in this publication may have been obtained from a variety of sources including Bloomberg, Macrobond, CEIC, Choice, MSCI, BofA Merrill Lynch and JP Morgan. The data used, or referred to, in this report are judged to be reliable, but Putamen Capital cannot be held responsible for the accuracy of data used herein.
