The U.S. economy continues to show economic resilience, with GDP expanding 0.8% q/q (3.2% annualized) in the final quarter of 2023. It appears that resilience continues into the new year with the Atlanta Fed GDPNow currently pointing to a 2.8% q/q (annualized) expansion for the first quarter. In addition, ISM Manufacturing and Services PMI may have bottomed, with businesses noting improvements in employment outlook.
With this continued strength in the U.S. economy, we are increasing the portfolio’s tilt towards cyclical growth by reducing our underweight position in the consumer discretionary sector. Valuation for the sector has fallen to the lower end of its historical range and is looking more reasonable at current levels, and profits have rebounded sharply amid the resilience of consumer sector. While we expect to see some softening in the job market, recent data releases do not point to an imminent weakness.
On the defensive side, we trimmed the portfolio’s exposure to consumer staples and added to healthcare. The outlook for consumer staples remains favourable, with the sector on the cusp of margin expansion and trading at a reasonable valuation; 20.1x forward earnings (67th percentile) and 16% discount relative to the benchmark (5th percentile). However, we believe the healthcare sector provides a more compelling risk/reward proposition following a deep profit recession over the past two years. We believe there is better potential for profit margin expansion in the healthcare sector versus consumer staples, and earnings have also rebounded more strongly from the cycle’s lows. Structurally, the healthcare sector also tends to compound earnings at a faster rate compared to consumer staples, which should translate to outperformance over the long run.

Sector Overview
Consumer Staples – Overweight in Conjunction with Healthcare
Valuation for consumer staples has flipped from very expensive at the beginning of the year to reasonably cheap currently. The sector was trading at 26% premium (97th percentile) relative to the benchmark in January 2023 but has fallen to 8% discount today (9th percentile). On an absolute basis, forward earnings multiple declined from 22.1x (97th percentile) to 20.3x (70th percentile). The depressed earnings expectations for the sector and reasonable valuation should translate to the sector outperforming if growth conditions turn out to be weaker than consensus, which we expect.
In addition, the decline in cost inflation (transport, energy) and food prices since March 2022 amid easing agricultural exports disruption from the Ukraine war should reduce input cost for many staples names and bolster margin in the coming quarters – something that has weighed down the sector performance throughout 2023. We remain overweight consumer staples in the portfolio.

Healthcare – Overweight
The healthcare sector screen expensive based on forward P/E ratio, trading at 21.3 forward earnings (100th percentile) largely due to the material drawdown in earnings outlook as the pandemic-era froth unwinds. Forward earnings drawdown in the healthcare sector currently stands at -24% compared to the average of -14% in previous cycles.
The sector has underperformed last year due to the erosion in operating profit margins and a Medicare reform proposal aiming to cap prices for 10 prescription drugs that account for the bulk of Medicare (Part D) spending. The uncertainty surrounding the negotiations will continue to weigh on sentiment for pharma, pharmacy/retailer, and PBM in the near term. At the same time, companies are adapting to the potential change in the regulatory environment by trimming drug trial candidates that provide inadequate returns on their R&D investment, which should translate to a healthy free cash flow yield going forward. The healthcare sector historically provides defensive exposure in a cyclical downturn and considering the potential application of AI in drug discovery and patient treatment, the sector should trade at premium relative to the benchmark. We expect healthcare sector’s earnings to recover soon and remain overweigh the sector.

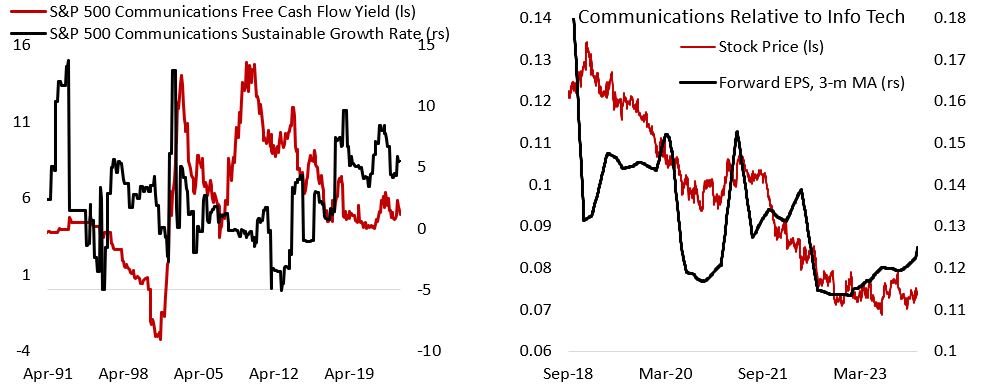
Communications – Slight OW
Given the sector composition is heavily tilted towards Google and Meta whose businesses rely heavily on advertising revenue, the potential weakness in consumer spending bodes poorly for the sector. However, the sector’s sustainable growth rate and cash flow yield remains attractive, and although absolute valuation at 19.8x forward earnings are not cheap, it is attractive when compared to the info tech sector at 32.9x. Relative to the S&P 500, the sector is trading at 11% discount (39th percentile). Meanwhile, the sector also enjoys tailwind from the positive development of AI through targeted advertising and better search function. We maintain slight overweight positioning on the sector.
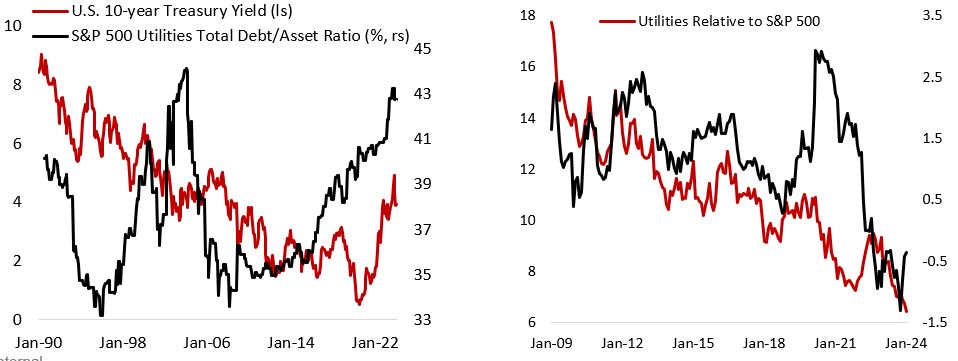
Utilities – Neutral
Utilities are among the worst underperformers for most part of last year and we have been underweight until early November. The high-leverage nature of utility operators and the backdrop of rising borrowing cost bode poorly for the overall sector performance. Not only have companies in the sector seen a dramatic increase in debt/asset ratio, but the sector’s dividend yield is also less competitive for investors needing income. However, over the past month long-term yields have been falling and growth conditions are deteriorating at a quicker pace. Utilities’ valuation has also improved materially compared to the beginning of 2023, with forward earnings multiple currently at 17.1x (62nd percentile) compared to 19.7x (89th percentile) at the beginning of 2023. In addition, the sector’s defensive characteristic is expected to provide downside protection if growth conditions turned out to be worse than consensus expectation.
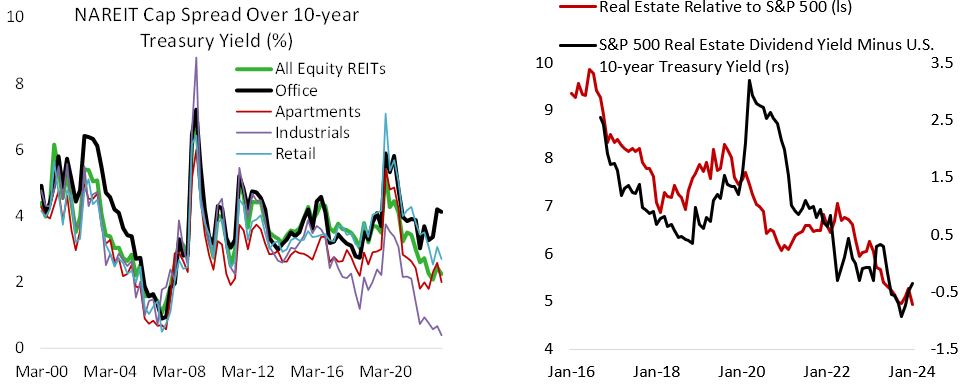
Real Estate – Neutral
Similar to the utility sector, real estate significantly underperformed for most part of this year amid the pressure from higher yields hurting the business model of commercial real estate. The high-leverage nature of its business and rising borrowing cost are weighing both the sector’s earnings and valuation. While cap rates (the discount rate applied in valuing real estate assets) for office has widened to level last seen during the global financial crisis, the spread over the risk-free rate is only close to the historical average. Meanwhile, valuation of industrial REITS is at a lofty level. However, we expect the sector to perform better going forward, especially if yields continue to move lower.
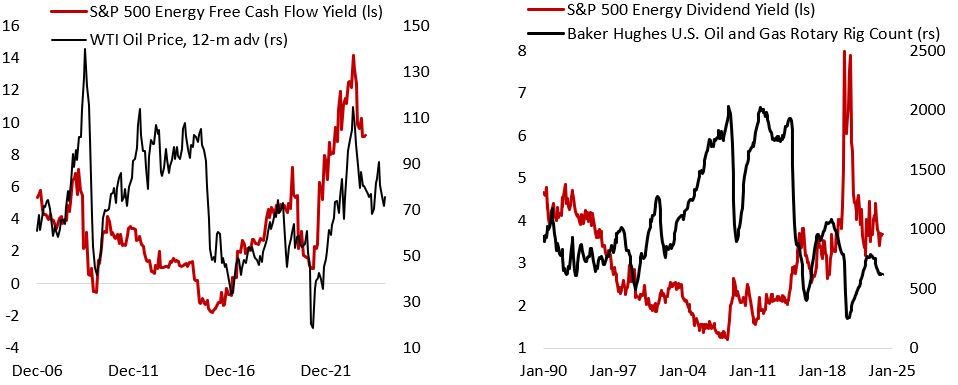
Energy – Neutral
Following an outperformance in the summer, the energy has been a detractor to the portfolio since late October. The war premiums surrounding Ukraine-Russia war and Israel-Hamas have ebbed. Meanwhile, Saudi Arabia is reportedly having difficulty in securing production curbs among OPEC+ members, as highlighted by Angola quitting the group, while U.S. shale oil productions are at record high level. On the demand side, developed economies’ growth are slowing and China’s economic recovery has been weaker than expected. Longer-term, however, lack of investment in the traditional energy space bodes poorly for supply growth and oil demand is expected to be flat-to-higher in the coming decade, which provide a floor to potential weakness as global growth slows. Valuation for the sector remains attractive at 10.9x forward earnings (20th percentile) and oil price currently remains above break-even price for major players ($57-73 for U.S. producers), which support current dividend payout.
Industrials – Neutral
The industrial sector has underperformed last year amid the global manufacturing recession and weaknesses in the transportation sub-sector. Relative to the S&P 500 benchmark, industrial sector valuation has fallen from a 17% premium (85th percentile) at the beginning of 2023 to a par (33rd percentile) currently. In the short term, the relapse in manufacturing PMI and downturn in global business cycle will continue to weigh on the sector performance. However, in the medium-term we are becoming more constructive on the sector amid multiple U.S. government efforts to bring production onshore, which is a tailwind for durable goods demand. We brought our portfolio’s industrial exposure from underweight to neutral in September 2023 and will look for opportunities to increase it further in the coming quarters.

Consumer Discretionary – Upgrade to Slight Overweight
Valuation for the average consumer discretionary firms is becoming cheaper, although the market-cap weight index is heavily tilted towards Amazon (30% of the sector) and Tesla (17%) that trade at a relatively rich valuation. The sector’s tight link to the health of consumers mean we continue to be cautious, but resilient employment outlook and greater efficiency in the sector could cushion the headwinds to the sector earnings. In addition, valuation for the sector is now at the lower end of the range over the past two decades, with earnings growth also outperforming the benchmark. We are reducing our underweight position in the sector.

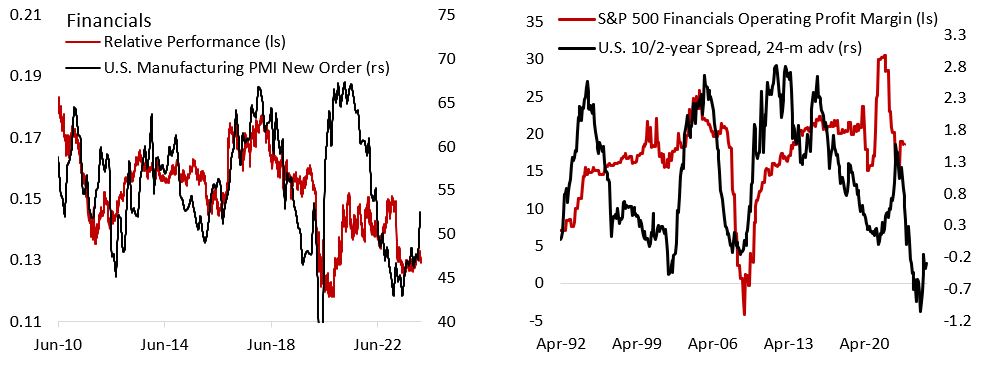
Financials – Slight UW to Neutral
As has historically been the case, the financial sector has underperformed the benchmark over the past year amid the regional banking crisis that erupted last March. Although deposit beta has declined somewhat, provision for bad loans continue to rise and the yield curve remains inverted. Banks continue to tighten lending standard and raise spreads over the cost of funding in expectation of an increase in credit risk. Auto and credit card delinquencies are now above pre-pandemic levels, and smaller businesses are reporting greater financing difficulty. The good news is that rising yields should translate to a fall in banks’ fixed income assets classified as available-for-sale and held-to-maturity.
In the U.S. regulators are looking to increase the capital requirement for non-GSIBs, which will put further pressure their profitability. The inclusion of payment processors into financial sector benchmarks this year has diversified the concentration of banks in the index, and the sector valuation is attractive relative to the benchmark. We remain slightly underweight financials in our portfolio.
Materials – Slight UW to Neutral
The tug-of-war between increased structural demand for base metals amid the transition to renewables and EVs and decelerating global growth leaves the material sector vulnerable in the near term but attractive over long the run. Earnings expectations for the sector have been downgraded significantly over the past year, with forward earnings drawdown of -31% vs the average of -35% in previous cycles. Valuation for the sector is fair, and we are looking to upgrade the sector once global PMI and the broader Chinese economy are showing more definitive signs of improvement.

Information Technology – Underweight
The information technology sector valuation became even more expensive over the past quarter on both relative and absolute basis, trading at 32.9x forward earnings (98th percentile) and 49% premium relative to the benchmark (97th percentile). The sector performance has been supercharged by the good news surrounding AI development, translating to AAPL, MSFT, and NVDA together accounting for over 50% of the MSCI World and S&P 500 IT subsector indices. In the longer run, we believe the sector will continue to outperform the benchmark given the high sustainable growth rate (retained earnings times return on capital) and decent free cash flow yield. However, the froth in valuation despite a higher yield backdrop should weigh the sector going forward. We remain underweight information technology in our portfolio.

Copyright © 2024, Putamen Capital. All rights reserved.
The information, recommendations, analysis and research materials presented in this document are provided for information purposes only and should not be considered or used as an offer or solicitation to sell or buy financial securities or other financial instruments or products, nor to constitute any advice or recommendation with respect to such securities, financial instruments or products. The text, images and other materials contained or displayed on any Putamen Capital products, services, reports, emails or website are proprietary to Putamen Capital and should not be circulated without the expressed authorization of Putamen Capital. Any use of graphs, text or other material from this report by the recipient must acknowledge Putamen Capital as the source and requires advance authorization. Putamen Capital relies on a variety of data providers for economic and financial market information. The data used in this publication may have been obtained from a variety of sources including Bloomberg, Macrobond, CEIC, Choice, MSCI, BofA Merrill Lynch and JP Morgan. The data used, or referred to, in this report are judged to be reliable, but Putamen Capital cannot be held responsible for the accuracy of data used herein.
