U.S. 10-year treasury yield rose significantly (+60 bps) in October amid strong Q3/23 GDP, reaching as high as 5%, before abruptly reversing this week following favourable treasury funding plan, lower-than-expected ADP employment and non-farm payrolls, and unexpectedly weak ISM manufacturing PMI. This trifecta of good news for bonds has translated to U.S. 10-year yield falling back to 4.57% (-40 bps MTD) as of the time of writing.
Many bond bulls, us included, have been fooled in calling the top in long-term yields throughout this year amid surprisingly resilient U.S. growth and employment. But it seems that the factors that drove yields higher throughout the year are finally reversing. Atlanta Fed Q4/23 GDP growth estimate has fallen to 1.2% as of November 1st from 2.3% the week prior, following a very strong 4.9% growth in Q3/23. ADP employment has been weaker than expected for couple months in a row, non-farm payrolls missed estimate in October, and the data for prior two months have been revised significantly downward. Given the faster deterioration in U.S. and global macro environment, long-term, risk-free bond yielding above 4.5% is looking very attractive to us. Remember that the higher the yield level is today, the higher the probability it will fall going forward. In other words, the probability of incurring capital losses decreases as yield rises.
One notable observation is that despite the decline in bond prices, asset under management of treasury bond ETFs have risen steadily over the past two years. This implies retail fund inflows into these securities outpacing the decline in prices. Strong retail demand for bonds, however, is offset by the rise in net short of treasury futures – a proxy of hedge fund and CTA positioning – as shown in the chart below (Chart 1 and 2). But even among the latter, net short position on U.S. 10-year futures has started to reverse.

The higher yield environment has raised the question whether the U.S. economy is hitting fiscal dominance – the possibility that accumulation of government debt and continuing government deficits can produce increases in inflation that “dominate” central bank intentions to keep inflation low. Chart 3 shows the long-term relationship between U.S. government budget balance and headline inflation, highlighting that period of higher inflation, including in the 1970s, tend to coincide with lower fiscal deficit. Even if we advanced government fiscal balance by one year to account for the lag between fiscal impulse and inflation, there is no proof that higher fiscal deficit is driving inflation higher.
Chart 4 also shows that there is no direct relationship between rising government debt level and inflation or rising long-term yields. In fact, the increase in government debt as % of GDP over the past 60 years has coincided with structurally lower yields. Long-term Treasury yields rose between 1960-1981 amid the spike in inflation, and government debt relative to GDP fell throughout this period. If neither rising government debt level nor fiscal deficit has impactful effect to inflation and long-term yields, then what is the driver of this year’s rise in yields?

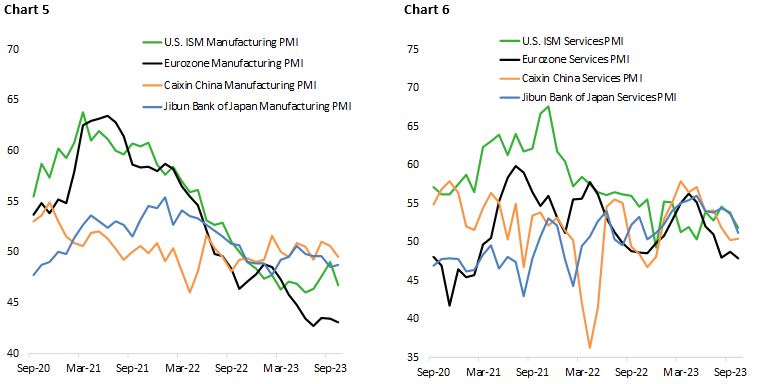
Many analysts are pointing to the possibility that U.S. economy is entering a new business cycle and the bond market is simply pricing out recession probability. However, we continue to be skeptical of this, considering ISM manufacturing PMI has relapsed (Chart 5) and the labour market is finally softening at a faster speed. The weakness in economic activity also extends to the non-manufacturing sector where services PMI continue to trend lower (Chart 6).
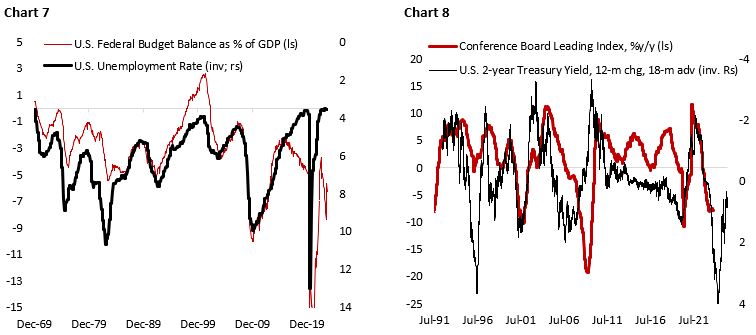
We think it is too early to dismiss the potential for U.S. recession in the coming year, as monetary conditions are still tightening and fiscal impulse (Chart 7) likely turn negative next year. The combination of diminishing fiscal thrust and lagged impact of monetary tightening could explain the continued weakness of U.S. leading indicators (Chart 8). The bottom line is that the U.S. economy is still at the late-stage of the business cycle, although the deterioration in economic growth, including consumer spending, is happening at a much slower rate in the current cycle amid pandemic-era stimulus and the U.S. government maintaining a larger fiscal deficit compared to historical norm outside of recession.
Tracking the Health of U.S Consumer
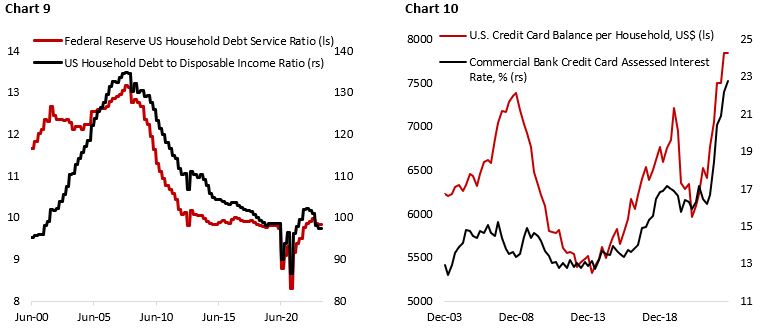
U.S. consumer spending continues to be above consensus forecast in Q3, although consumers are seeing increasing strain from higher borrowing cost and inflation. Household debt service as a share of disposable income is back to pre-pandemic level (Chart 9) and its interest payment component is rising fast from as low as 1.2% during the pandemic to 2.6% currently (2010-2019 average at 2%). The Q3 growth in real PCE (0.1% q/q) is also outpacing the growth in real disposable income (-0.2%), meaning that consumers are increasingly reliant on savings and credit card to finance their spending (Chart 10).
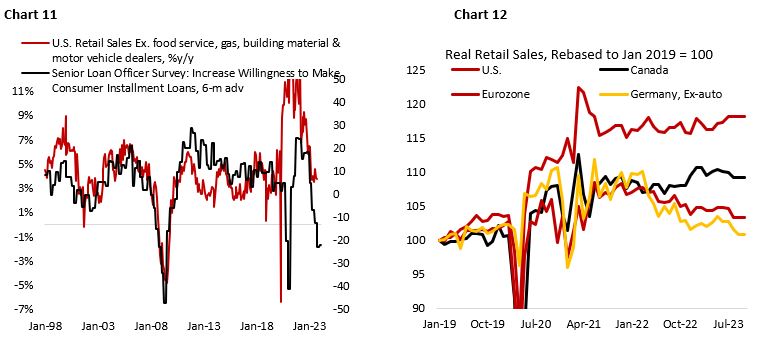
The good news is that “core” retail sales of 3.7% y/y has fallen to below trend nominal GDP growth of 4% – a sign that growth of consumer spending is no longer above potential. Chart 11 shows that tightening consumer lending standards should continue to weigh on retail sales in the coming two quarters. Note that the case of robust consumer spending is not a global phenomenon. Consumers in the rest of the world are reducing their spending as the impact of tighter monetary policy is starting to bite (Chart 12). With Canada likely entering technical recession (two consecutive quarters of negative q/q growth) and European economy also faltering, U.S. economy will likely again be the last man standing in this cycle. This could provide near-term support for the dollar and US capital flow.
Tracking the U.S. Labour Market and Wage Growth
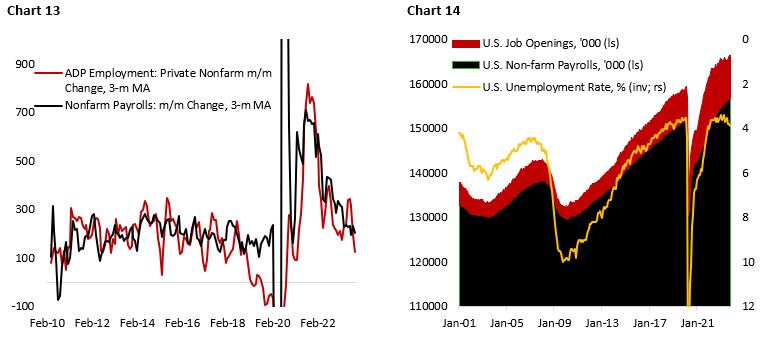
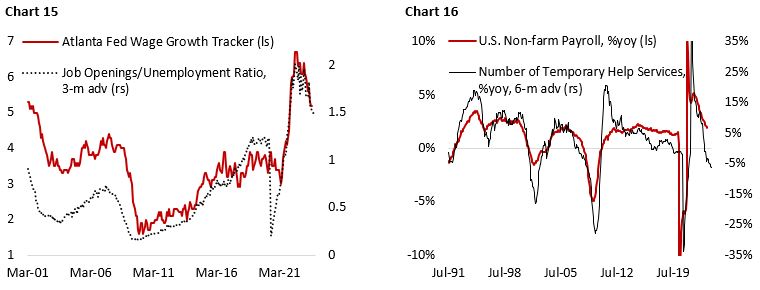
We argue that October’s employment data could prove to be a turning point in this cycle. The labour market condition is now ticking almost all the box in policymakers list. Although job openings remain high, monthly job gains have now fallen to a rate consistent with pre-covid levels (Chart 13). The household survey result is worse, with 348.000 workers dropping out of employment in October compared to in September. Moreover, unemployment rate rose to 3.9% from the cycle’s low of 3.4% (Chart 14), and average hourly earnings growth continues to slow (Chart 15). This is all a welcome news for policymakers in their effort to bring inflation back to its 2% target, translating to the market pricing in a more dovish policy rate trajectory in the coming year. For consumers, however, this means disposable income growth could slow and jobs will be more difficult to find, which should translate to a weaker spending down the road.
Now that the hiring rate has been brought close to a balance, the sensitivity of the labour market to change in financial conditions should be back to pre-covid era. Chart 16 shows that the number of temporary help services continue to decline on annual rate of change basis, which historically led the non-farm payroll growth by about two quarters. Given the feedback loop between growth, employment, and consumer spending, a much lower growth and employment outlook is likely in 2024.
U.S. Equity: Lofty expectations being tested
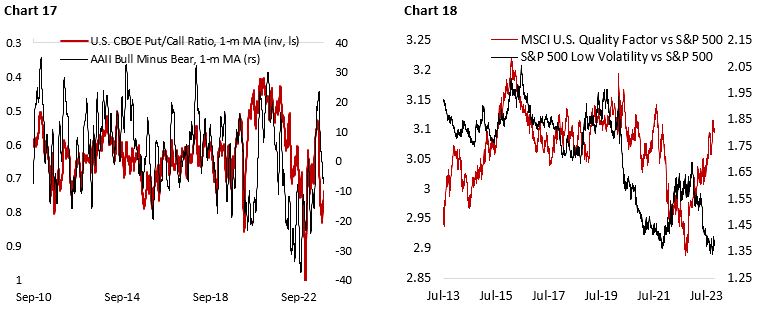
Following a difficult August to October period, U.S. equities ripped last week amid the expectations that the Fed is done raising policy rate in this cycle. This knee-jerk reflect is understandable, given the extremely bearish sentiment over the past weeks (Chart 17). Retail investors had been turning bearish since August and put/call ratio reached an extreme bearish level at the end of October. The easing in financial conditions from lower treasury yield will likely translate to U.S. equities churning higher in the near-term.
More importantly, the shift in trajectory of rates could spur a rotation from quality factor to low volatility. Quality factor’s massive outperformance this year has been primarily driven by the strength of mega-cap growth stocks, whereas low volatility has been dragged down by traditional defensive performances that are weigh down by higher rates environment and the pricing out of recession. A lower yield trajectory and slower growth should favour the latter.
On the earnings front, the S&P 500 forward earnings continue to struggle to tick higher, staying at $217 compared to $218 seen at the beginning of 2023. The percentage of earnings beat in Q3/23 is higher than historical average, but at the same time negative forward guidance has outnumbered positive one, causing analyst to trim Q4/23 and FY24 estimates. Currently, analyst consensus for earnings growth expectation in the next 12 months is at 12%, significantly higher than the expected nominal GDP growth of 4-5% and diverged from the historical relationship with change in monetary policy (Chart 19 and 20). We remain cautious on U.S. equity earnings, hence our preference for defensive sectors.

International and EM Equity: Cyclicals weighing equity benchmark, China is stimulating
We expect international and EM equities to underperform in the coming quarter amid the relative strength of the U.S. economy supporting greenback performance and the fact that tighter global financial conditions weigh the performance of international and EM assets more than in the US. Chart 21 shows financial conditions in China is very tight amid the property crisis, lackluster consumer demand, and government’s earlier reluctance to stimulate the economy more aggressively. Meanwhile, Europe is facing high energy cost, elevated borrowing rate, and geopolitical upheaval that impacted its industries, including in the EVs and chemical processing sector.

Although U.S. and Canada have also seen financial condition tightening, they are relatively mild compared to for EM and Europe. EM countries have seen their financial stress rising of late due to rising dollar and higher government borrowing cost (Chart 22). Historically, initial signs of financial accident tend to be observed in this group. Japan remains the only region with loose financial condition amid BoJ’s refusal to hike policy rate despite inflation and inflation expectations also trending higher – translating to extreme yield differential and weakness of the Yen.
Update on Sector Valuation and Earnings Drawdown
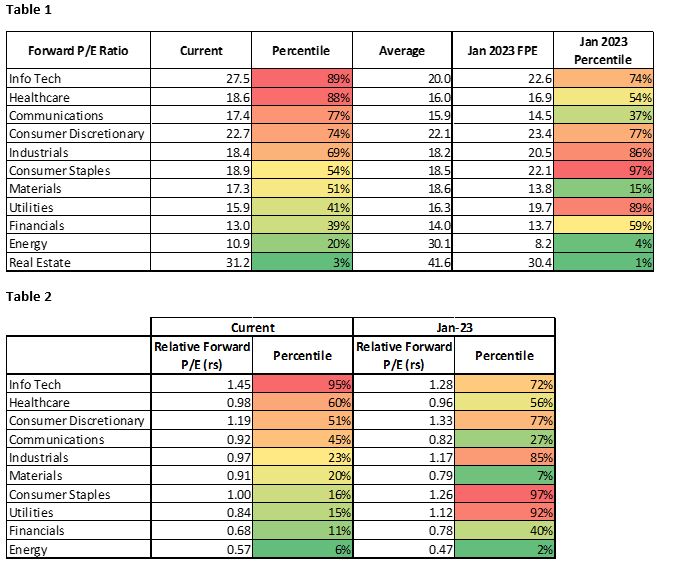
Valuation for six out of eleven S&P 500 sectors remain above historical median, driven primarily by valuation of growth sectors (IT, HC, TC, CD). Meanwhile, traditional defensives (UT, CS, RE) are becoming more attractive (Table 1 and 2). As discussed earlier, if yield trajectory is going lower, we should see rotation into low-volatility defensive sector from quality stocks (info tech and consumer discretionary). This month we upgraded utilities and real estate to neutral from an underweight position and further downgraded info tech from slight underweight position.
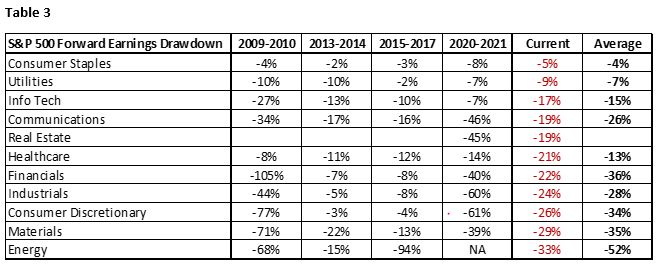
On earnings perspective, we highlighted the current drawdown in each sector’s forward earnings relative to their historical average (Table 3). Obviously every period of equity market correction is different, but in general cyclical sectors tend to suffer more relative to their defensive counterpart. The downward revision in financials, Industrials, discretionary, material, and energy sector may have further to go.
Table 3
Copyright © 2023, Putamen Capital. All rights reserved.
The information, recommendations, analysis and research materials presented in this document are provided for information purposes only and should not be considered or used as an offer or solicitation to sell or buy financial securities or other financial instruments or products, nor to constitute any advice or recommendation with respect to such securities, financial instruments or products. The text, images and other materials contained or displayed on any Putamen Capital products, services, reports, emails or website are proprietary to Putamen Capital and should not be circulated without the expressed authorization of Putamen Capital. Any use of graphs, text or other material from this report by the recipient must acknowledge Putamen Capital as the source and requires advance authorization. Putamen Capital relies on a variety of data providers for economic and financial market information. The data used in this publication may have been obtained from a variety of sources including Bloomberg, Macrobond, CEIC, Choice, MSCI, BofA Merrill Lynch and JP Morgan. The data used, or referred to, in this report are judged to be reliable, but Putamen Capital cannot be held responsible for the accuracy of data used herein.
